We’re still waiting to learn the effect of Brexit on London’s status as Top Dog in the financial world — because Brexit hasn’t happened yet. Since the June 2016 Brexit vote in the U.K., there have been 3+ years of agonizing over how (not to mention when) Britain should leave the E.U., all of which has held the London financial scene somewhat in limbo.
In 2017 and 2018, there was a lively debate here in the forum, in a thread titled
At that time, opinions were divided on the question you have raised, and from what I am reading, opinions are still very much divided.
In broad terms, we can say that some London business has fled to Frankfurt and other venues in the E.U., and some bankers and brokers in London have lost their jobs (or been relocated) as a result.
But, as the BIS 2019 Triennial Survey reports, London retains a commanding share of the worldwide FX market — a share which is, in fact, increasing.
So, when Brexit has finally happened (next month, maybe), and the dust has settled on a new world order in the E.U. (some months, or years, from now), will London emerge as leader of the financial world? — Take your best guess. — Plunk down your 10 quid, and place your wager.
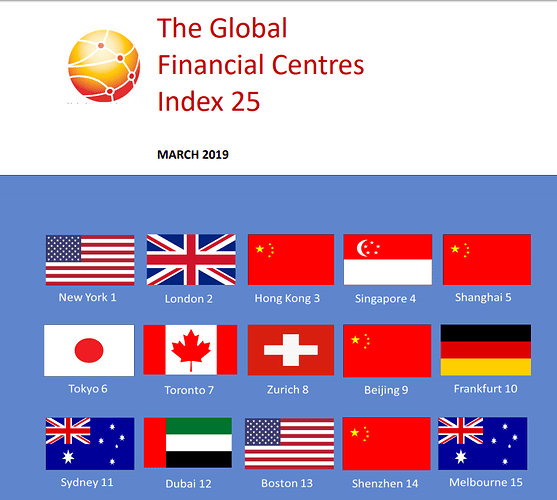
In the thread referenced above, there was discussion of the Z/Yen Global Financial Centres Index. The rankings determined in that Index are based on many factors, including job opportunities and quality-of-life issues, and therefore reflect more than FX market share. The latest Index, released in March 2019, showed a slight increase in the spread between New York (ranked #1) and London (ranked #2).
-
In September 2018, it was New York rated 788, and London rated 786.
-
In March 2019, it was New York rated 794, and London rated 787.
-
Both cities rose in the ratings. New York rose a little faster than London.
-
The September 2019 Global Financial Centres Index has not been released, but is due any day.
Regarding FX market share:
-
In the BIS 2016 Triennnial Survey, London held a 37.1% share of foreign exchange trading,
and New York held a 19.4% share.
Note that the 2016 Survey period (April 2016) was 2 months prior to the Brexit vote in the U.K. -
In the BIS 2019 Triennial Survey, it was London 43.1%, and New York 16.5%.
Note that there is no mention in the 2019 Survey of a Brexit effect on London’s FX market share. -
London’s share increased over the 3-year period between Surveys, which also happens to coincide with the 3+ years of debate over how Britain should leave the E.U.
Here is a link to the March 2019 Z/Yen Global Financial Centres Index.
And here’s a graphic (from the March 2019 Index) showing the top 15 cities —
