Master Graviton Esq.,
At the risk of poking the cranky diamondback rattler with a stick ; have you had time to check out the link Tymen provided? I think it would really help people like beehjae understand how you personally define bubbles, squeezes, etc. Maybe clear up a few of his and others questions.
It is my understanding that the so-called no-go areas were only defined as a result of newer traders having trouble on CT trades; and that these will be removed once he returns and the method is refined as a result of all our experiences. Of course, we will have to wait & see.
PS. Still looking for a sufficiently grumpy garden gnome for your avatar
I"m going to disagree with Master Tang here. That’s a sausage, as a bubble will not continue in the same direction as it was going after the opposite BB has curved it. Also, a bubble has a PA that goes directly to the opposite BB.
Look at the end of the BB walk that you posted. Look at the band it was walking. See how it curves inward when the PA reverses?? In my observation, it happens about 80-90% of the time with there is a PA reversal in either a sausage or bubble.
I look for that before I enter (in demo of course) on a PA reversal.
There is a fairly typical BB squeeze on your chart. The part before the deep fall in PA there, there is a narrow area before the bands widen, and the PA is quite level. That squeeze is on the 8 or so candles previous to the 8:00 candle on the 4th of May.
Whenever the mid bb is quite steep, as this is, it has the momentum to keep going in the direction of the trend. That should be a signal to exercise caution about entering a counter trend trade. I recall posting a chart similar to this one as it was happening, but Tymen said he didn’t think it would be good for a ct trade because of the steepness of the mid bb. He was absolutely correct. The pa made a quick return to the trend and did not get even halfway to the mid line. The lesson I learned was to be aware of the steepness of the mid line.
There is no valid short CBL in that timeframe. You’d have to step down a frame or 2 to find the CBL. However it would be in the long candle at 8 am. That would be your short entry…
I see, since I would like to follow Tymen’s recommendations, I won’t go any lower than M30. At least I still didn’t miss anything, given that m30 is my minimum.
I’ll be mindful of the steepness moving forward, however, it seems subjective again as to what is steep and what is not so steep.
I misunderstood the question… There is a valid cbl, but entry per tymen’s rules are a bit tricky… CBL would be on the 6am candle for the short. If you refuse to use a lower chart than m30 for entry, you will be looking at the end of the bottom of the 7:30 am candle. However that candle is bottomed out on the lower BB. I will have to let further comment to those with more knowledge.
BTW, I"m using a 3 candle CBL…
Speaking of tricky entries, this is the post I was referring to when regard to beehjae’s comments about the difficulties he is facing with bubbles, sausages and no-trade areas.
I would ask people to determine entry points using strict BB DNA rules on this TF alone. It raises yet again the issue some people have with BB DNA, which is that it does not get you into trends.
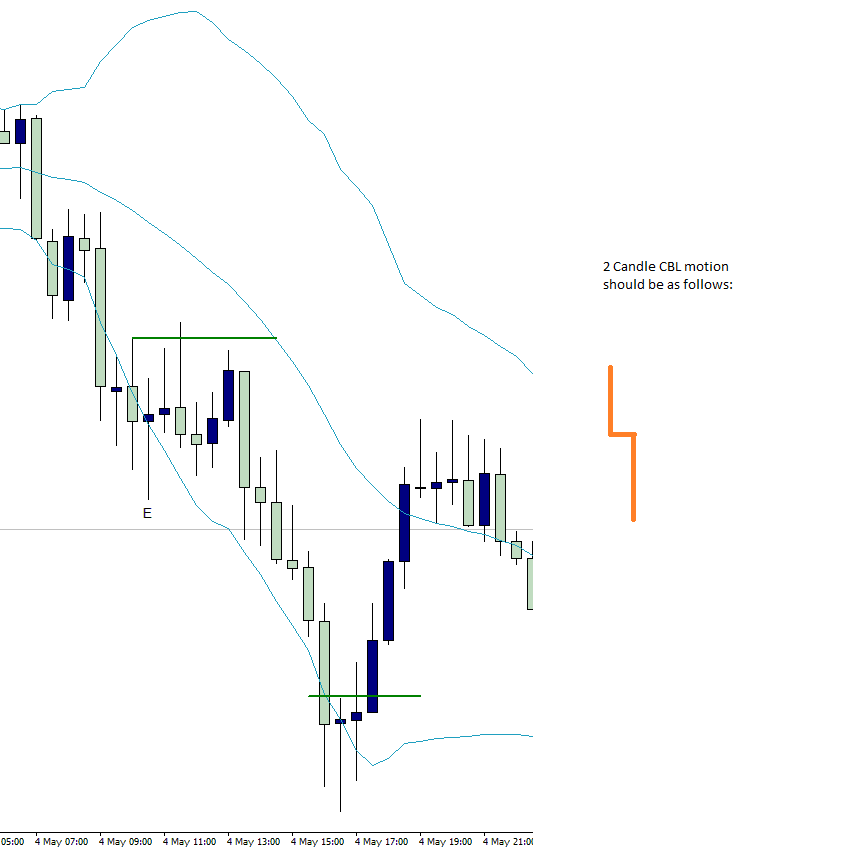
I have provided a chart of how I understand the 2CBL strategy.
We take the most extreme candle with the lowest CBL and go one candle to it’s left (as long as the candle on the left has a higher high) - we draw the CBL on the high of that candle on the left, like I have done on the chart shown.
I have marked the extreme candle with E.
There are no closes above this CBL line and this would have stopped you from entering this trade.
I’ve already posted this in Graviton’s thread but also wish to add it here: if you haven’t registered with the chat room you’re missing out on some good learning and experience, along with the camaraderie of fellow forex traders - many of whom are now enjoying real success with BB DNA.
I have set up a brand new tool for BB DNA learning and sharing, a Vyew whiteboard for BB DNA here: Bollinger Band DNA Vyew
Feel free to bookmark this link and visit it whenever you’d like to make a fast screenshot to share with others. You can even keep chat open in one window (or tab) with the whiteboard in another for quick reference.
All parties sharing screenshots and uploaded images can annotate these pages together, dynamically sharing content on a remote electronic “whiteboard” any time day or night. Voice chat and Live Desktop Sharing is now also available there.
For a brief overview of some of what you can do, here’s a link for a streaming video I made illustrating some of the whiteboard’s features: BB DNA Whiteboard and Video Conference preview
So now we have something quite versatile to enjoy: Live sharing of trades, sophisticated chart presentations that are fast and easy to do, and the ability to share voice communication without having to worry about who does (or does not) have certain software installed.
After spending more time in the chat room and reading Gravitons thread, I found he provided an excellent explanation of how to avoid this issue by dropping down in time-frames until suitable entry points begin to emerge and then stepping back as you continue with the trend. Issue solved!
This is one heck of a tool Merchantprince - just yesterday I was talking to Beehjae and was just thinking of how useful a tool like this would have been!
My understanding is that with the 2 candle cbl a close beyond the cbl is not required. An entry can be made as soon as pa crosses the line. But with the 1 candle cbl a close beyond the cbl is required as well as a smaller candle body.
Please correct me if I’m wrong. Of course the other requirements must be met as well.
 ; have you had time to check out the link Tymen provided? I think it would really help people like beehjae understand how you personally define bubbles, squeezes, etc. Maybe clear up a few of his and others questions.