Ok, after some demo testing and requests, I can now reveal the technique that I am currently developing.
The idea is to use higher TF charts such as the daily and 4H to anticipate a move. This typically involves analysis of the Bollinger Bands from high time frames down to lower time frames.
There is absolutely no new material here - everything that I use has already been taught Tymen and Graviton, I’m just using them in a slightly different way.
------------------ EXAMPLE TRADE ------------------
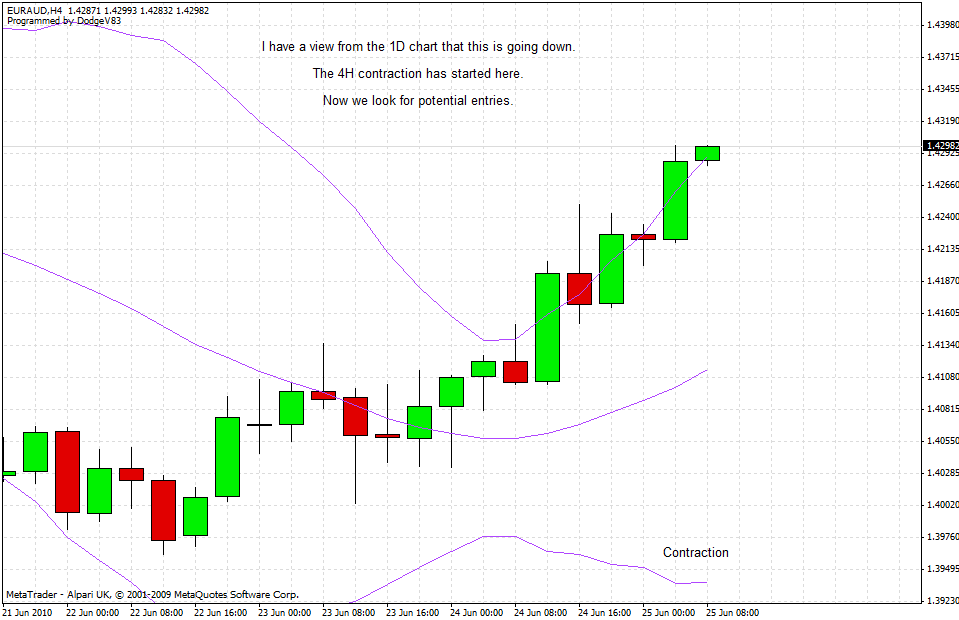
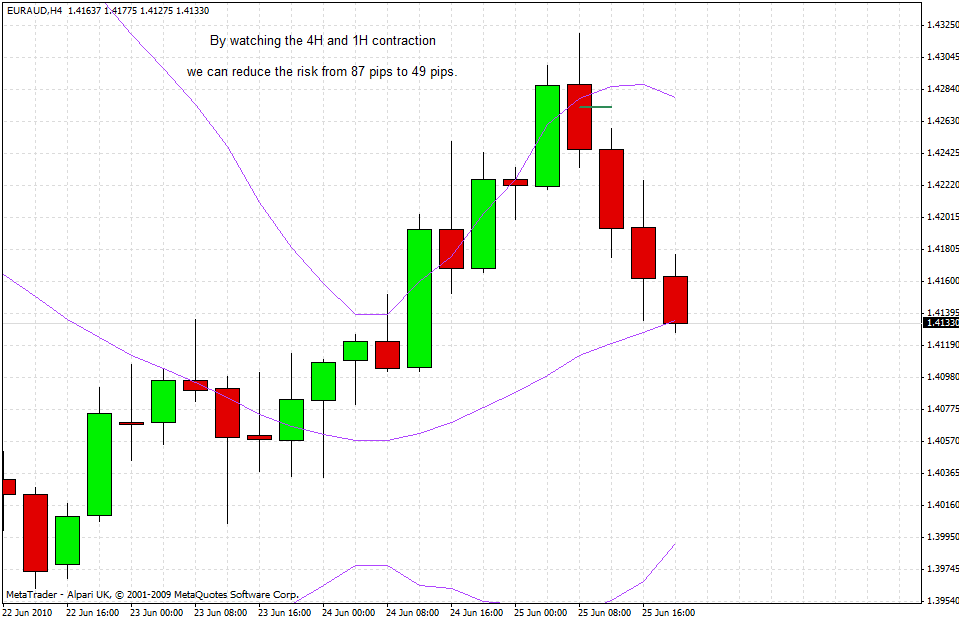
Above is a chart of the 4H EURAUD. This part is relatively unimportant but I have a view from the daily chart that this is in a sustained downtrend and could still have a way to go down. Usually, I wouldn’t worry about the long term trend, though.
The important thing to notice on the above chart is that price is going up but the outer band has begun contracting.
This tell us that one of 2 things is going to happen:
- Price will fail to close higher and begin a retracement, creating a bubble.
- Price will continue to go up, creating a sausage.
We now drill down to the 1H time frame to see PA in more detail…
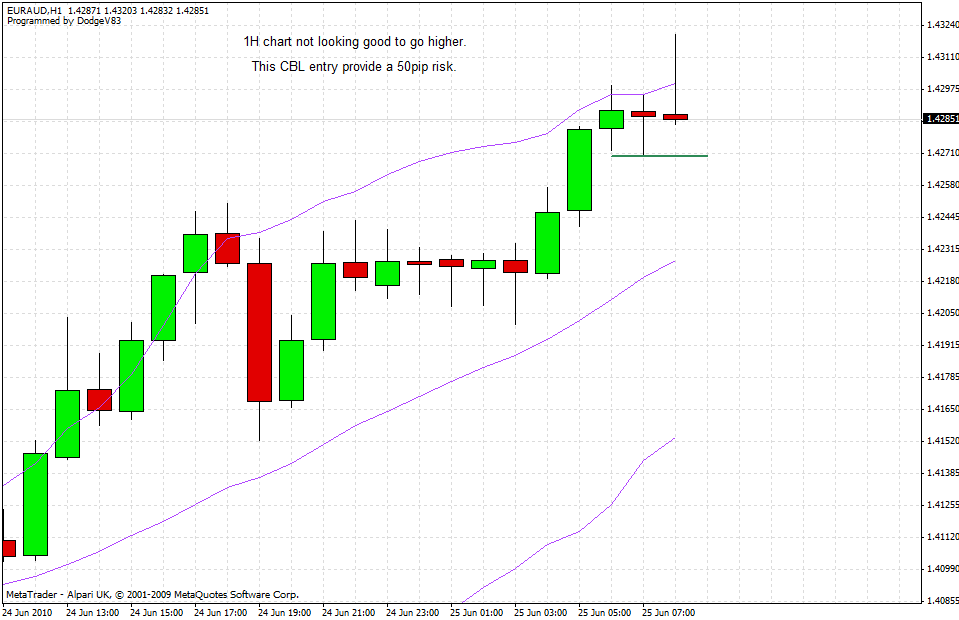
On the 1H chart we have a sausage, so the contraction happened a while ago. The current PA will be looking bearish if price fails to close above the previous candle, especially with that long doji candle.
The CBL I have drawn on this 1H chart is for illustrative purposes only - if we enter on the breach of that CBL, we will enter with a 50pip risk.
Now we drill down to the 30M chart…
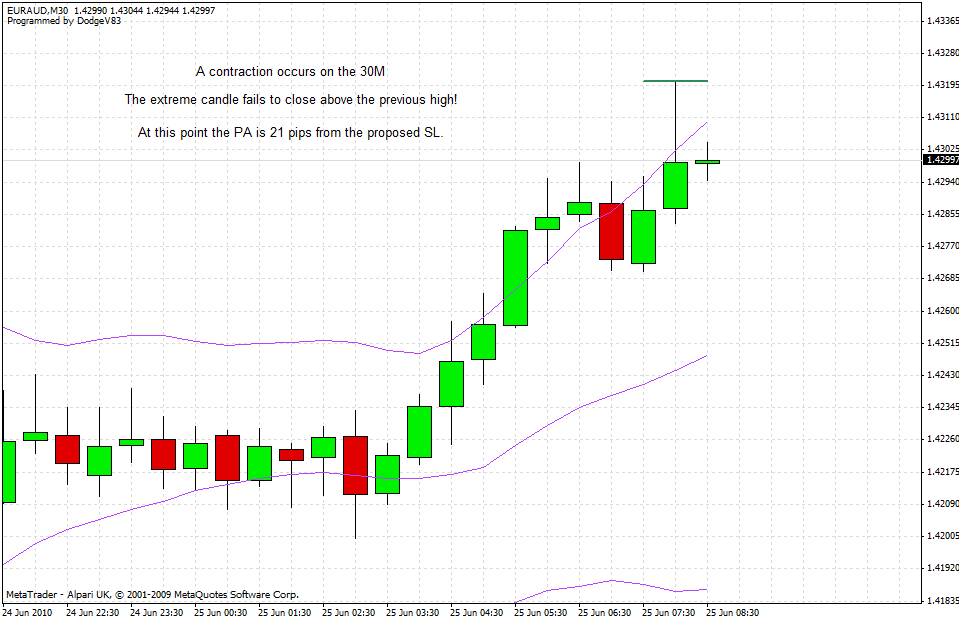
The 30M chart paints a nice picture - the extreme candle fails to close above the previous high and the outer BB begins contracting! The important thing to note is the contraction of the BB.
Now that all Bollinger Bands from the 4H down to the 30M have begun contracting, we can look for an entry on the 15M time frame.
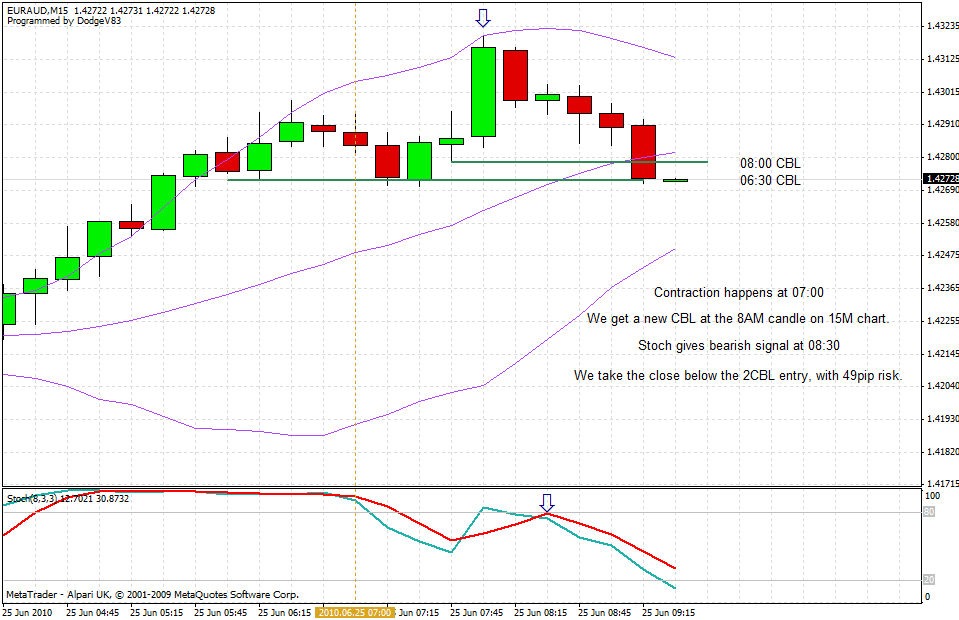
Notice on the 15M I am also using Graviton’s stoch(8,3,3) - this is just for extra confirmation. I don’t think it’s a good idea to swear by the stochastic since it is just a lagging indicator, but can provide useful confirmation to help be more selective with your trades.
All I do on the 15M chart is draw a traditional 2 candle CBL but my rules for entry are slightly different.
To get a valid entry signal:
- I wait for a close above or below the 2CBL (in this case - I’m waiting for a close below the 2CBL because I’m shorting).
- Stoch must be bearish - getting a crossover from overbought downwards or a crossover from oversold upwards is fantastic.
As long as these two conditions are fulfilled, I enter immediately at close.
On the picture above, I entered at the close of the long red candle, which is at the lower green line.
My risk with this entry was 49 pips.


