I am not even recovered of the last lesson you taught us; I will ony say you are truly gifted Tymen, in more than one way.
Bows
I am not even recovered of the last lesson you taught us; I will ony say you are truly gifted Tymen, in more than one way.
Bows
Will then check my already available sources, thank you both for fast answer!
Thanks very much for your comments PirchTird on my first effort.
I totally agree with your taking direction from higher time frames, I do this religiously in my trading to get into only high probability trades. Two reasons why I didn’t follow that rule here, one is quite simply that I wanted to practice the placing of the trade so I was taking short & long, and secondly after a cliff edge fall from the beginning of June USD/CHF has been ranging so no real direction to follow. Once I get my eye in and the technique down I’ll be a lot more prudent in my choice.
Trade A, yeah I could well have misunderstood this, I thought it was to avoid nasty retracements, but I need to go over this big candle entry again.
Trade B, yes the 3.3 has nothing to do with it as an entry it’s for the exit I know, but it does confirm the extremeness of the candle. I’ve removed it per Tymens advice.
Trade C, I have trouble with the whole bubble sausage thing, I need to put in some work on trying to identify these much better early on, but it seems a solution is in the pipeline!
Trade D, I think your right, this is probably in a no trade zone.
Thanks again, I obviously still have a lot of work ahead of me in studying all this, good job I like learning new things, thank god for demo! 
One question, has anybody found the ultimate time frame for this yet?
…sorry to post in the middle of your lesson Tymen 
It is impossible to tell early on in a BB walk whether you are going to have a BB sausage or bubble.
[B]The two are quite different but the difference is simple…:)[/B]
[B]Bubble[/B] - when the price action pulls away from the BB and retraces, it continues to retrace and does not recover.
[B]Sausage [/B]- when the price action pulls away from the BB and retraces, it does so for a while but then the price action recovers and restarts the climb of the BB.
Sometimes this new climb is a little distance away from the outer BB line.
One question, has anybody found the ultimate time frame for this yet?
Don’t look for it because there is no such thing!!
Tymen
I have looked at the problem that VulcanClassic noted with regard to pairs such as XXX/JPY. The following code should meet the needs of most pairs automatically.
I have again added “_kw” to the indicator name so as not to overwrite yours. If you want to use this version you can remove the “_kw”. But please note you will give no offense to me, if you wish to retain the version that you have already published.
When looking at USD/JPY it cuts the enter_long and enter_short line far less than looking at GBP/USD. IF YOU AGREE I will look at this aspect, to see if normalising the calculation improves the occasions that the PA crosses these lines.
Ken.
///////////////////////////////////////////////////////////////
indicator AA_BB_slope_meter_kw ;
input pipdiff = 3;
draw zeroline(“zeroline”, solid_line, black,2),
entry_long(“long”, solid_line, green,2),
entry_short(“short”, solid_line, red,2),
res(“slopemeter”, solid_line, blue,2);
vars i(number), avg(series), pip_fctr(number);
begin
if close[back(close)] <10 then
pip_fctr := 0.0001
else
pip_fctr := 0.01;
zeroline := makeseries (front(close), back(close), 0);
entry_long := makeseries (front(close), back(close), pip_fctr * pipdiff );
entry_short := makeseries (front(close), back(close), -1*pip_fctr * pipdiff );
avg := sma(close,20);
for i := front(close) + 20 + 1 to back(close) do
res[i] := avg[i] - avg[i-1];
end.
////////////////////////////////////////////////////////////
Thank you for those definitions, could someone tell me if I have correctly labeled this Sterling chart.
Sorry to be asking a stone age question but this has been bugging me.
I’d class them as a Sausage and Bubble respectively.
When the lower Outer BB starts to contract the price action in the sausage still walks its way up higher along the upper Outer BB.
Later, when the lower Outer BB starts to contract the price action moves completely away from the upper Outer BB. Also, the price action does not go higher than the point at which the Outer BB started to contract. That second part is important to keep in mind too - it’s not just about the price moving away from the upper Outer BB once the lower Outer BB starts to contract.
Other more learned folks than me might chime in but this is my understanding at least.
Ok guys, the MT4 indicator is now complete.
You can play with the settings to change the colours or the “pipOffset”.
The “pipOffset” is the pip difference you would like between the zero line and the buy/sell lines.
The buy line appears as a green line and the sell line appears as the red line.
To ensure everything is working as it should, I would really like to compare the results of this with the GFT indicator for at least 1 major currency and 1 JPY based currency.
I would really appreciate it if someone could post a 15m chart of a particular period for, say, EURUSD and one for USDJPY, so that I can compare results.
Thanks.
BB Slopemeter.zip (753 Bytes)
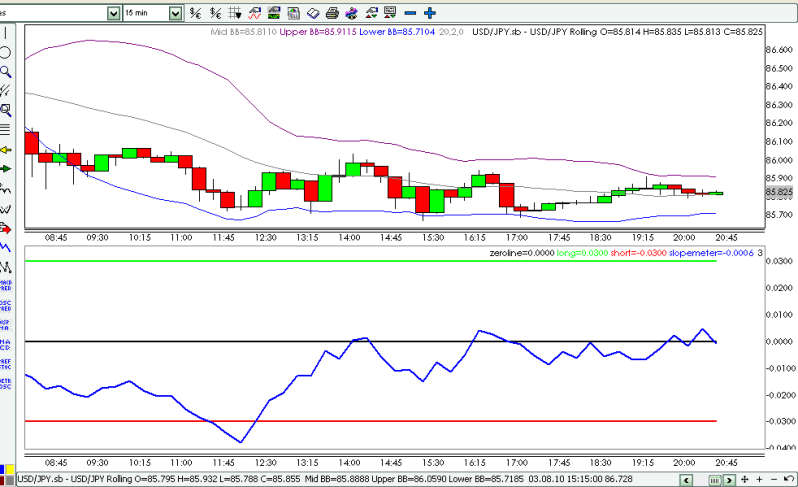
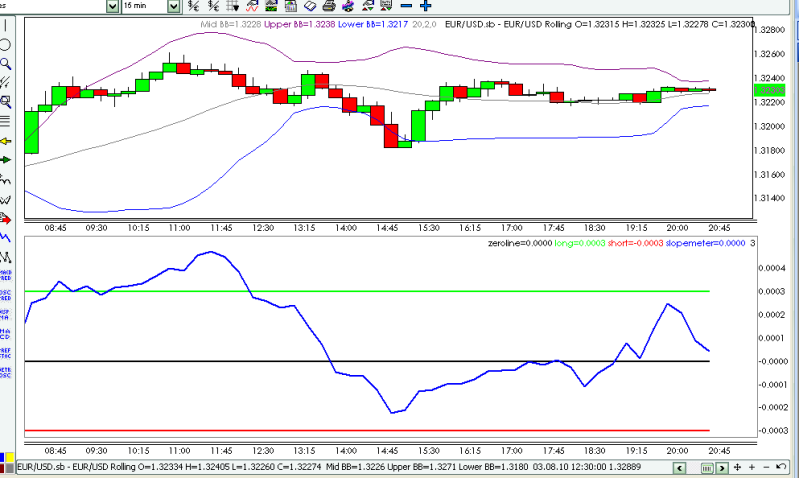
I have a couple of charts below, as requested. They are 15M covering roughly 12 hours. The top is USD/JPY and the bottom EUR/USD.
Excellent, thanks very much.
I’ve compared the results and they are both identical.
The MT4 indicator is ready to use!
Please report any bugs found, as I have only tested it with a 5 decimal broker.
Did DNA chat go down for a bit - I was just having a great chat with H. and i had to leave for about 10 minutes and now I can’t get back in?/?
Quick and Excellent work Ironheart
Thank you for your Indicator
I am very much happy about “very very ACTIVE and DEDICATED” members like you in our forum Ironheart
Also,Thanks a lot tymen
Looks like we had our first ever chat crash, which is weird. The site is still up.
[I]UPDATE:[/I] This is bizarre. I get a customer support ticket from Ning that says “Congratulations” we sold enough merchandise to get the ‘basic’ package free for year. The only problem is:
a.) I never filed a support ticket with them.
b.) We did not in fact sell enough merch to get the free annual of the basic service.
c.) We don’t want the basic service anyway as it does not offer, you guessed it, a chat feature.
I am contacting them now.
Pleased :), Merchantprince, that you are aware and on top of the issue.
I also noticed and thought it weird, for so long there was 1 shirt sold and still needed three, and in fact within that 10 minutes - simply hypothetical here - that 3 additional shirts were sold - we met our goal and walla chat is gone.
oh well.
I appreciate the opportunities afforded me so far, and I am quite sure Hordane will continue the conversation either on chat or elsewhere, I patiently await . . .
Chat is restored. I just went ahead and bought a month of the paid service. That will give us enough time to keep chatting while everything is evaluated, anyway.
Tymen,
I’m not sure if I’m doing this right, but when the slope line on my indicator crosses long or short, that’s about when the price action seems to take off in the opposite direction.
hi,
i have a 4 decimal broker and the lines are flat in my indi
if i go to a timeframe above 1 day…there seems to be some movement, but below that tf nothing
do i supose to change something in it ?
thanks in advance
Thanks PB, this is all helping 
Tymen
I did look into the aspect of normalising the calculations last evening. However although this produced a graph that was in the same range for all currency pairs, it completely messed up the entry level line values. A classic case of solving one problem but creating another. As a consequence I do not feel there is any mileage in looking into this further.
It would, in any event, mean that IronHeart would need to change his indicator and the followers of MT4.
One thing that it is important is the value of the entry line and knowing that you are producing figures for different time frames there is no point in me following this idea further.
Ken
You haven’t got it upside down have you?
Can you post a chart to show what you mean because I am confused? :o :o