THE JOY OF CANDLESTICK TRADING - Part 2

I welcome any and all criticism :slight_smile:

[B]1) The initial 5 minute chart showed the mid BB going up against an evening star short trade.
A no no entry here - wait!!
Too dangerous.[/B]

Understood. Iā€™ve been doing it wrong all along!

[B]3) We are meant to do a 2nd entry!! (where is it???)[/B]

It is my understanding that the second entry is saved for a more favorable price if the trade goes against me. Your graph shows 2 initial entries, is this because of the sharpness of the Starc Bands?

Thanks for the help!

~Rob

Congratulations on posting that chart, [B]Merchantprince[/B]. :slight_smile: :slight_smile:

However, there are many errors here and I do not wish to be seen criticizing you for you efforts. :slight_smile:

[B]Muthu[/B] had pointed out a major error already - he is correct in what he says about the price action walking the upper BB.

So much so in this case that 2 short patterns are definitely needed here for this short trade to be successful.

Go back to post page 91/92 of this thread and see my diagrams on the correct use of the BB.

  1. [U]There is no dark cloud pattern to be seen.[/U] Go back to page 91 on this thread and study the 6 patterns I have drawn - posts #901 onwards.

  2. The mid BB on this main chart is rising very steeply, confirming that a short trade taken would be a disaster.

  3. A 15 minute main chart is really too short in timeframe. Try a 30 minute if you cannot get one in between.
    Pattern reliability increases with longer timeframes.

  4. Further, a 15 minute chart cannot be substituted for a 5 minute chart.
    We use a 5 minute chart because it is very sensitive.

  5. The patterns are only used on the main chart - in your case, say 30 minutes.
    The 5 minute chart does not use candlestick analysis but rather the starc bands.

  6. The RSI is irrelevant to this candlestick method. Having it there just takes up room and reduces your chart size.

  7. Consider the advantages of using a white background chart. From my years of teaching experience I can tell you that a black background generates a lot more eye strain than a white one.

Try again!!
Soldier on!! :slight_smile:

Even if the BB were in your favor, this is not a valid Dark Cloud Cover pattern. Check the graphs posted by Tymen1 yesterday. Also, the strategy calls for the lowest time period to be 20 minutes, but youā€™re basing the trade on a 15 minute chart.

Yes - and also because that long red candle means that price was dropping rapidly!!

In fact the 2nd short entry in this case would not be as good as the 1st!! :eek:

But thats the way it goes sometimes!! :smiley:

Soldier on!! :slight_smile:

Ah, our posts have crossed over.

The outer BB on which the candlestick pattern is placed is the important one.
This band should be preferably at least level, inwards is much better.

If it is expanding mildly, then treat the potential trade with much caution.
If it is expanding very strongly, then the trade will be a disaster unless a 2nd pattern appears as shown on page 91.

Previously, I had been trading breakout price movements based on coming out of the contraction of the outer Bollinger bands, indicating a run in price, one way or another.

We have found thro experience and feedback that the candlestick patterns for breakouts or expanding Bollinger bands seem to be unreliable, namely the 3 green soldiers pattern and the 3 red rosellas pattern.

I do not see a circumstance under which the mid-Bollinger band ever evens out. Is this a consideration?

On the main chart, the direction of the mid BB is not so important as long as it is not extremely against your trade direction.
On the 5 minute chart the [U]direction of the mid BB is absolutely critical.[/U]
No trade should be attempted against the direction of this mid BB.

When no strong evidence of support or resistance is clear from previous chart history, should exits for the second amount be determined based on a Fibonacci indicator?

You should really exit both amounts at the same time - at the best possible opportunity. That will make the most pips.

A TP can consist of the mid BB on the main chart
OR
a Fibonacci indicator
OR
the opposite outer BB if the trade shows that potential.

It is also apparent from my looking at charts today that I do need to have the 5 minute charts open in order to see any evidence of the BB bands curving inward.

Since we look at the state of the outer BB on the main chart, the 5 minute charts have nothing to do with it.
The 5 minute chart has its own BB, the most important one being the mid BB.

Glad I was able to help! As soon as I figure this system out Iā€™ll post as many videos as I can :slight_smile:

OK, thatā€™s it from me for now.

I am very tired, even exhausted. :eek:

I am going to take a break for about 48 hours and do my own trading. :slight_smile: :slight_smile:

By that time the posts will have built up here and more replies will be needed.
I will then post full diagrams of the [B]Advanced level strategy.[/B]

[B]I would appreciate it if others can pitch in and help give the answers to questions and problems if you think you know the answer.[/B]

[B]That will not only take the strain off me, but by answering questions you will greatly strengthen and impove your own understanding of this method.[/B] :wink:

Dodge:

I have loaded successfully the templates and it is working well. Thanks. However, when i tried to load the template on 15 & 30 min time frame, it does not seem to work and price is frozen on these time frames. Is it because these time frames are already available on mt4? In such a case do i just manually place the bb and starc bands on those time frames and look for trades. In one of your posts you said 20 min is the shortest time frame to look for trades (main chart). I remember reading we can till 15 min. Perhaps Tymen can clarify.

I already had two successful trades. Now I have to figure out how to post charts. I do have the link that Tymen posted on how to post charts. I will look in to it.

Thanks once again to you and the original poster of this wonderful time conversion indicator and template (Sorry I forgot the name !)

Regards,
Muthu
Chennai, India.

Thank you Tymen:
Enjoy your well deserved break. I am sure you will have lot of questions to answer once you come back :wink:

Muthu.

Yes. When you open an ā€œofflineā€ chart for 15 min or 30 min, you are literally opening an ā€œofflineā€ chart. The reason the 20 min, 25 min, and 40 min ā€œofflineā€ charts work, is because the Period Converter is programmed to inject data into them 100 times a second (or whatever the number is). If you want a 15 min or 30 minute chart, use the regular version, not the offline version.

Well, remember, those time frames donā€™t get the Starc bands, only the 5 minute chart does. I have posted my ā€œmodified tymen not 5ā€ template for you, this is the one I used in the video for all non-5 minute charts.

Tymen said this about the subject in his last post:

3) A 15 minute main chart is really too short in timeframe. Try a 30 minute if you cannot get one in between.
Pattern reliability increases with longer timeframes.

Looking forward to seeing your trades!

modified tymen not 5.tpl.zip (568 Bytes)

For about the 100th time in this thread, you deserve a massive thank you from me for the amount of effort youā€™ve put into this thread and strategy

Even though I only started on Monday, Iā€™m quite glad to finally be at the end and loved it when I noticed the post dates turned to ā€˜Yesterday,ā€™ made it feel a lot more personal in some weird way! Anyway, another reason Iā€™m glad to be at the end is because I seem to constantly be wanting to comment and help others as I have found that this strategy comes to me quite easily and I can understand most of it really well (I hope!) so will hopefully start being able to help others and post up my own threads, although the candlestick patterns never seem to form, even though Iā€™ve got 36 charts up (12 major pairs in 25, 30 and 40 minutes) but persistence wil prevail :smiley:

And one for luck:

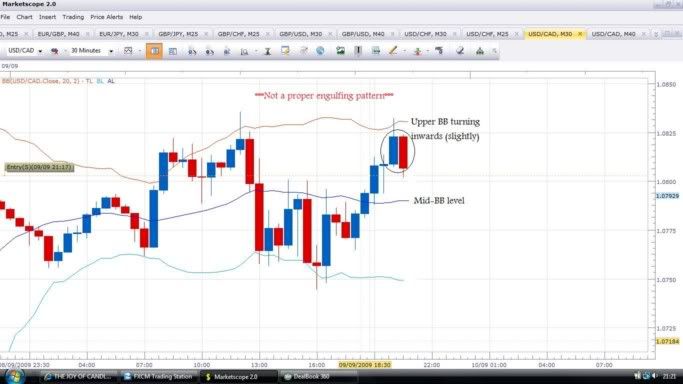
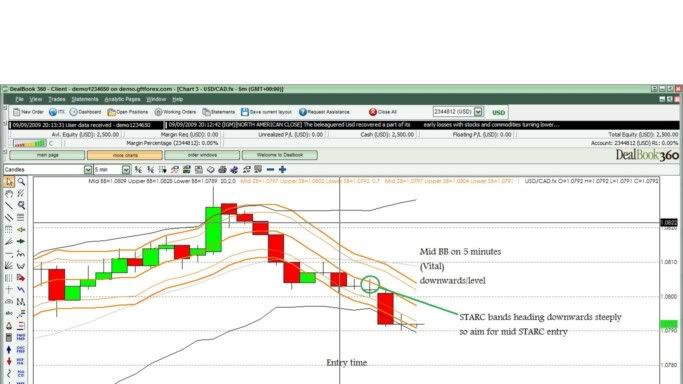
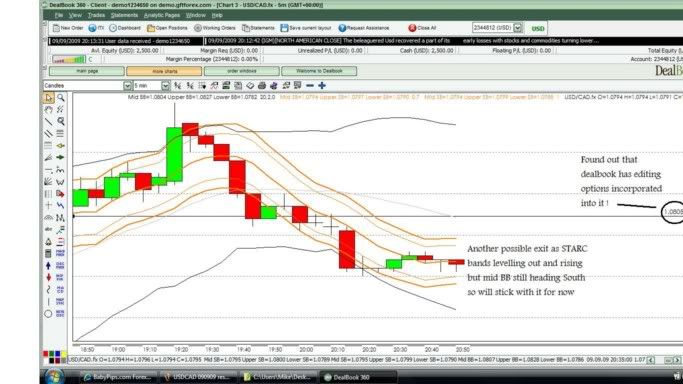
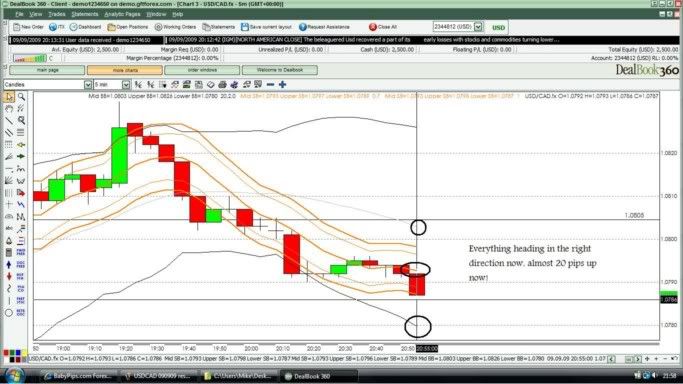
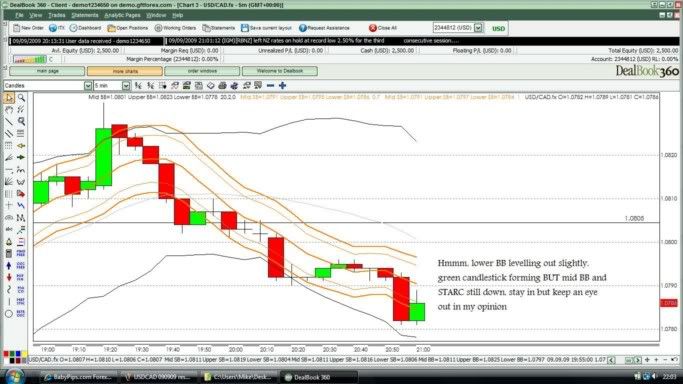
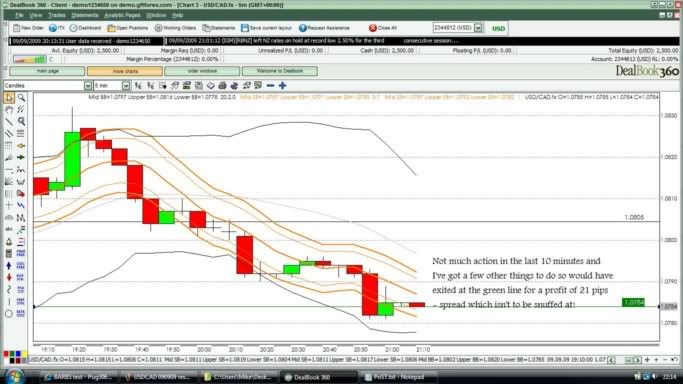
I had a quick look at my charts and found a ā€˜fakeā€™ engulfing pattern but though I may as well study this for a bit anyway, so before anyone says anything, I [B][U]would not[/U][/B] have taken this trade live! I know I should have used two entry points but my laptop was being quite slow and I just decided that Iā€™d try recording what I would have done so overlooked that part. Constructive criticism welcome

More to comeā€¦

I will try and remember to post up what could have happened if Iā€™d stayed in the trade in the morning (Im UK so its 10:20 and Iā€™ve got an early start to go to the beach in the morning :slight_smile:

Edit: I know my charts are a bit screwed up so will try using fireworks from now on to make them a bit clearer and of better size

I was about to create a Youtube video for you on how to create a PDF file from OpenOffice, but you already said you canā€™t watch Youtube videos :frowning:

Your computer doesnā€™t have flash installed?

Anyway, an easy way to do this is with OpenOffice. It is an open source version of Microsoft Office and has a simple ā€œExport to PDFā€ button. If you can do trade Forex candlesticks you can definitely create a PDF :wink:

(If not, just send me the .doc file and Iā€™ll convert it for you)

Regarding the screenshots, you shouldnā€™t need fireworks to make them nicer. I just upload to imageshack.com check the ā€œResize Imageā€ and set it to 17" monitor. It literally takes 5 seconds from start to finish, no need to waste time in fireworks or any type of photo editor.

Regarding the trade, the execution looks good! The main thing to take from this, I think, is not to let ourselves get caught up with the success of bad (low probability) trades.

About an hour ago I saw an opportunity where I could have made a quick 30 pips by trading between the 0.7 and 0.1 bands as Iā€™ve been doing before one of Tymenā€™s latest posts.

Instead, I followed his rules and made the 30 pips anyway, possibly more as the trades are still open.

So yes, the Starc bands combined with the BB are very powerful, even managing a good profit under adverse conditionsā€¦but lets try not to make a habit of it :o

I know what you mean but I find it easier to use as you can properly zoom out and see the whole canvas rather than have the picture taking up almost all of my screen and not being able to see things properly

Regarding the trade, the execution looks good! The main thing to take from this, I think, is not to let ourselves get caught up with the success of bad (low probability) trades.

I would not have taken this trade live!

:slight_smile:

Oh I understand you wouldnā€™t have taken it liveā€¦but it looks tempting donā€™t you admit? :stuck_out_tongue:

Yup, it looks tempting now but hindsight is 20/20, it wouldnā€™t have looked tempting at the time that I would have entered and by the time it would have looked tempting, it would have been too late :wink:

[B]WOW!!![/B]

Dealbook 360 rocks!!!

Potaire

Appreciate a little help for setting STARC Bands on MT4. I have found this indicator and would love to implement the STARC on my station, but not sure about the settings.
At the moment my standard settings are : 6 - 15 - 20 - 1, and it is looking similar to Bolinger bands. How i can set this indicator to look the same as every one is using here ? :confused: