Doing an exercise such as this will help you to learn the system… teaching others is a superb way to learn… I suggest that you start to undertake this project almost immediately . you will find that you already know a lot and will quickly learn more.
Looking back at the GBP/USD 20 minute chart on Thursday, moving forward one candle at a time, looking for trades.
The videos are about 10 minutes each, going through a complete trade from beginning to end, trying my best to mimic a live trade. I also make a brief comparison of GFT to MT4 at the end of each video.
Trade 1a - Dark Cloud Cover
YouTube - Thursday Trymen Trade 1a
Trade 1b - Comparing GFT to MT4
YouTube - Thursday Trymen Trade 1b
Trade 2 - Piercing pattern
YouTube - Tymen Thursday Trade 2
Trade 3 - Morning Doji Star
I have been having a similar situation and I am in Canada…
dunno…
Excellent work with the video presentation…
It is so much easier to see things in a video and having the facility to back it up and watch repeatedly makes things easy to grasp.
Thanks so much for your efforts.
Dodge:
You continue to be a wonderful contributor to this thread and this video is very valuable. I appreciate your efforts for this great work.
Regards,
Muthu.
Chennai.
India.
The first trade in this video highlights one of my nagging questions. On the 20m chart you clearly have a winning trade with a proven pattern on the bottom Bollinger, but you switched to the 5m chart and had to watch helplessly as the ‘noise’ on this chart kept you from entering.
If the criteria was met was on the larger chart, why not just enter after that triggering candle ends?
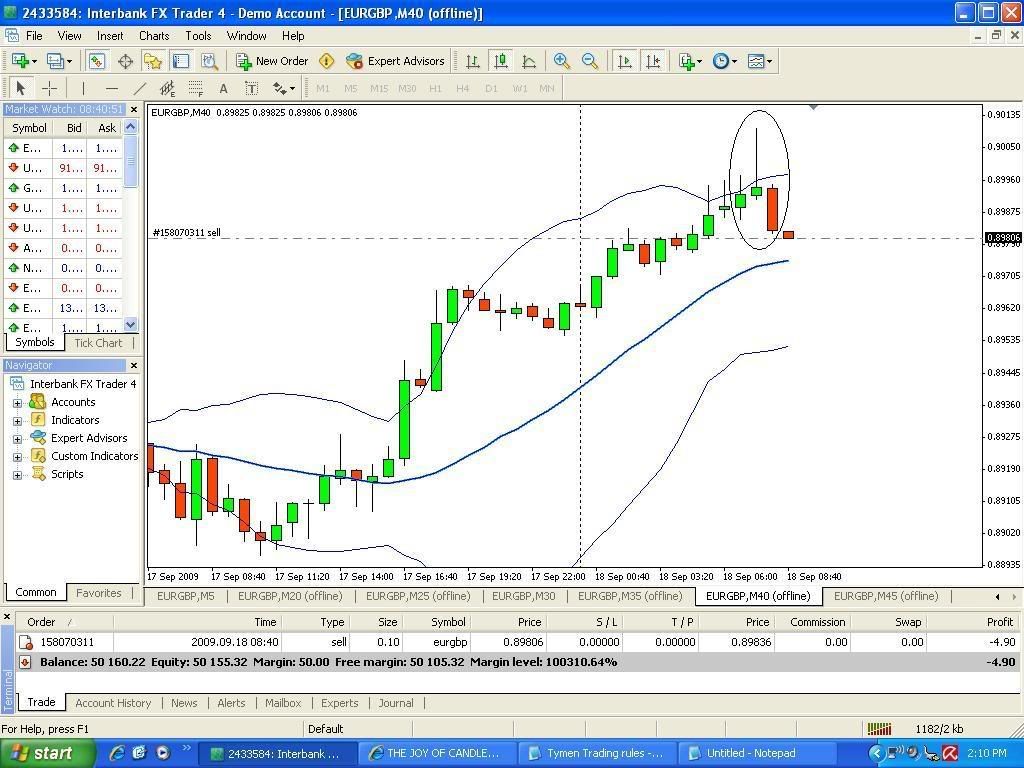
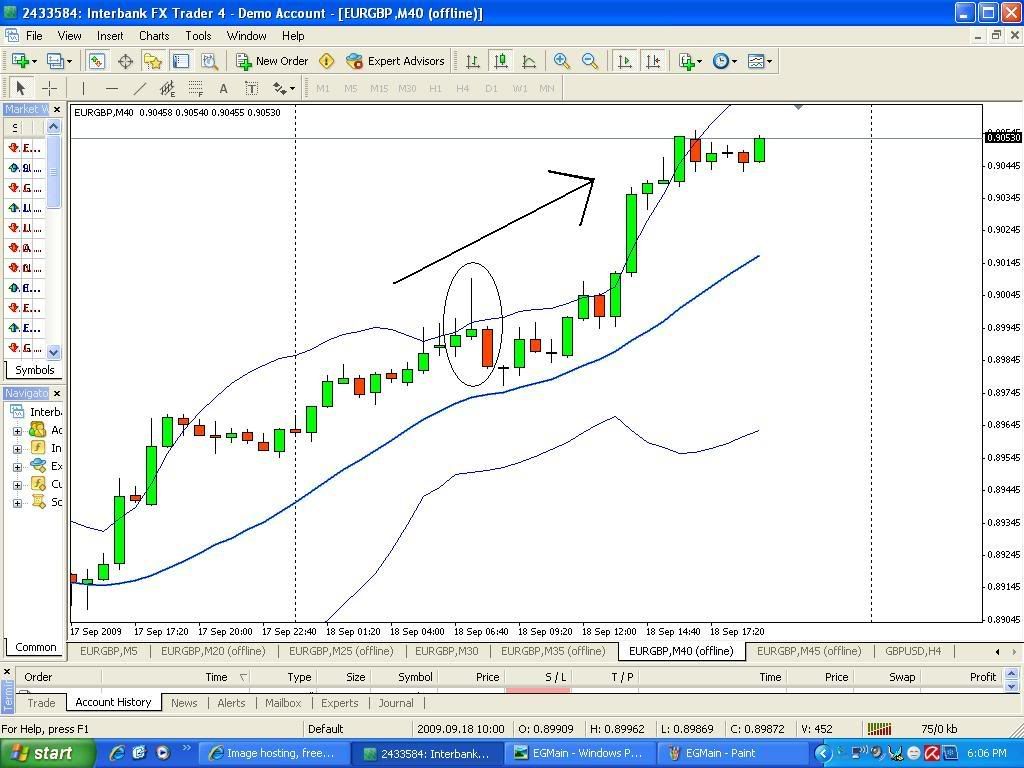
I wanted your valuable comments on a failed trade that i took yesterday. It was E/G Short that i took off what looked like a evening star to me. What was wrong in the trade ?. I thought even though the bbs were climbing, it shows signs of flattening right after the pattern. Was this the problem or the first candle in the pattern which had wicks both at top and bottom ?. The beautiful shooting star (mid candle) followed by the huge red candle convinced me of a good pattern which was not to be as you can see in the next chart. I even waited and made sure i got a good entry in 5m (bb flat and stocs down and then entered as was evident from the 4th candle that already started forming and just started to go red.
Regards,
Muthu.


My first real post (my other 3 were before I understood anything)…this feels good 
I’m on the edge of entering the world of Forex. I have gone through the School of Pipology. I’ve been reviewing different strategies that people are using, and had narrowed it down to the Cowabunga System or this system. And have now decided the wonderful world of Candlesticks is the way for me 
I am at page 50 of the original “The Joy of Candlestick Trading” thread. It’s very difficult and time consuming to go through so many pages of messages just to pull out the ones that explain the system.
I have Dealbook on my computer. I have it setup with the 4 main pairs at the variety of time frames 20m - 1hr.
I’m wondering if anyone has gone to the work to pull all of the notes on this system together? I’m sure some of the older posts in the original thread are out dated with better rules for entering/exiting etc.
If not, I might post my current understanding so people can point me (hopefully) to the point in the thread where my understanding can be improved.
Oh, and I would like to show Tymen my appreciation for his massive amount of work teaching this system. It is very rare that a person would give up there time to teach something without wanting something in return. And even more rare that they would stick with it over such a long period of time. Thank you Tymen. Your approach of teaching things in an easy to understand way is a big reason that I have chosen this system.
Muthusai,
Here is what I see in your chart. The pattern looks fine to me. But the mid BB line is still going up pretty steeply, a warning sign to look for a 2nd reversal pattern. You did not include your 5 min entry chart showing the STARC bands and mid BB on that chart. Were they going the same direction? Down?
Merchantprince,
Tymen’s basic method covers entering from the main chart. There is not a lot on the basic method on this tread (maybe at the begining, it’s been a while since I read that far back) The advanced level gets more precise on entries to maximize pips and since entering 2 amounts, helps limit how far negitive your pips go before going your way.
Merchantprince, I found the post on the method of entering from the just the main chart. On this tread go to post #896, click on the link, then open the PDF, go to pg 14. You will find the rules on the basic method.
Jack:
Thank you for your valuable comment. I didnt get a chance to grab the 5 minute. However, i made sure stocs were going down and bbs were flat before entering; thats why as you can see on the main chart, i didnt enter immediately and entered after the 4th candle formed and became red…(the dotted horizontal line shows the entry point on the 4th candle)
Regards,
Muthu.
Chennai.
India.
This is your failed trade on the GFT platform

Here is the 5 minute chart for the entry at 9:40

The only way to have made a profit here, would have been to immediately enter, then exit on the brief breakout of the bottom Starc band. Yes, for a grand total of 4 pips!
Would never happen.
The way I see it, one of two things happened:
A. The initial pattern was bad.
B. No matter what it was a failed trade.
Considering A: The Evening Star pattern calls for a short wick on the first candle. This wick isn’t “short”, but is probably short enough. It is possible either the first candle is too small compared to the third candle. Maybe if the third candle body completely engulfs the first candle body (It looks to be 5-6 times bigger!), it is an invalid pattern?
Hopefully Tymen can help on the question above.
I don’t think the BBs are going up so sharply to warrant 2 shorting patterns, so I did not consider this.
Dodge:
Thanks for catching the 5m chart for me. It helped me to re analyze the trade. Yes i was in profit for a brief while before it shot up.
Muthu.
In my opinion it was just a failed trade. I don’t think you did much wrong. The BB’s were going up, but not a lot and I think I too would have taken this trade. You must remember that no method/system is perfect and from time to time this will happen. If nothing else you now have some experience of such a trade. Were you able to learn anything about when to get out of the trade, or did you just let it hit your stoploss?
Mickey:
Thanks for your wise thoughts. I just let hit hit my SL. I must also learn when to get out early if we get early indication of a strong possibility of loss.
Regards,
Muthu.
Chennai.
India.
Hello,
If i may answer, the trigger actually is in the 5m chart and not on the main chart in the advanced method. The entries are only based on how the mid bb and starcs behave in the 5m chart. If they are not in favor we wait till it gets our way. Possible scenarios after we spot a pattern in the main chart, we go to 5m and look if any of the following conditions satisfy.
- Mid bb flat and Starc flat
- Mid bb flat and Starc in our trade direction
- Mid bb and Starc in our trade direcion
After a pattern is seen on the main chart, we wait to see if any of the above conditions satisfy. If not we don’t trade.
Regards,
Muthu.
Chennai.
India.
This is my first reply back again after nobody could get thro to the forum.
I sent an email to the Admin, they replied very quickly telling me that they were on to it and more work still needs to be done.
Well, at least I am online for now again anyway.
This thread is again growing so fast I cannot keep up.
But then again, I am very busy preparing that PDF, so I am not always here.
Please bear with me until the PDF is ready.
I have still to look at those u tube videos by [B]DodgeV83[/B].
I will answer some essential matters right now. 
Tymen I have a question for you (or if anyone else knows the answer please chime in).
Let’s say for example we have a short trade on the main chart that we want to take. Everything looks ok so we go on to the 5 min chart. Now we know that both starc and BB’s must be in agreement (ie at least level if not in our favour). So let’s say that the mid BB is going down (so far so good), but the starc bands are rising slightly. So we wait for them to go at least level. Now here is the question. If during a 5 min candle the starc bands are slightly up, but the the candle begins to drop and the starc bands level out, do we at [U]that point[/U] take the trade, or must we wait until that 5 min candle has finished (after all it could rise again) to see where the starc bands finish?
Hope this makes sense.
Mickey.
Which time frame do most of you use for your main chart? I’m finding it is hard to get the 1H chart to show a trading signal, based on the fact it very rarely shows a flat mid Bollinger.