ruilima,
Open your WINDOWS EXPLORER (not Internet Explorer) go to your C-drive where you installed MetaTrader4. Now click on search, type .tpl and it will find it for you.
Or: go to “C:\Interbank FX Trader 4” (if you use IBFX) then folder “templates” and there is your .tpl. You will also need to post the .mq4 that are related to this particular .tpl.
They are in C:\Interbank FX trader 4, folder “experts” then folder “indicator”.
Thanks, I just noticed that it you change an indicator like the stoch oscillator it will have the changed attributes automatically every time you add it to a new chart. So I guess one needs only make the changes once anyway in MT4.
ruilima,
Just looked at your attachment. I never install anybody elses .ex4.
Of course if you don’t want that anybody knows how the indicator was done then so be it.
See Tymen thread (Finest trend trading) when somebody coded profanity (or worse) into the code. :eek:
.mq4 is the one anybody could see the code and of course also change it. 
By the way, I added the MTF_Moving_Average indi to my chart in MT4 but all it shows is a blue line; I don’t get the channel bars from Rui’s chart example.
now the first thing we want to see is the price go out of the dailly channel.
the second thing is the stochs cross one of the levels lines from outside to inside. that means when it cross the 10 or 20 level line from the bottom to up them we should go long and the oposite to go short.
after the stochs cross the level lines and give us a signal to go long or short we should move to the 5mins chart and wait until a retrace of the price that bring the stochs again to the overbought or oversold area and them enter the trade when they cross the stochs again in the direction of the 1H stochs.
that will become our new higher low or lower high.
after enter the trade we should move the TF to the 1h TF and hold the position until the stochs cross from the OB to OS zone and oposite.
if the stochs in the 4h chart were also in the OB or OS zone when we open the trade we should hold part of the position until the stochs in the 4h chart cross from OB to OS too.
like i said still need to be more improved but those simple rules will give a good win% ratio with a good rr ratio too… but it will made us miss some good trades
i don´t even know what a code is 
i know how it looks from what is see in tymen´s thread but that´s all.
that indicator was posted in here by someone else… before me, i just put it in this page so you don´t have to look for it
i can´t find it
OK guys, I have finally sussed out the settings for the MTL indicator (thanks to Brad in chat for walking me through it) and have put together an MT4 template for Rui’s updated MMTT using the new filters.
The template is uploaded to my server and you may download it by right-clicking the link below:
MMTT Template for March 24, 2010
(BP forums apparently won’t allow me to attach a .tpl file.) I have named the file “mmtt-032410” so any subsequent changes to the template can be renamed with a later calendar date, making it easier for readers to know which template is the latest edition.
Included in this template:
[ul]
[li]std 20:2 Bollinger band[/li][li]MTL indicator which displays the 2-period daily moving average regardless of time frame[/li][li]24/5/5 stochastic oscillator with the 10/20/80/90 level lines[/li][/ul]
I am partially colorblind to some shades of the red-green spectrum and I use a light-colored background for trading, so you may want to change the colors I have set for the template. They are: Teal for the BB, Navy for the MTL and on the stoch I use blue for the signal line (making the main line white makes it invisible) and olive for the level lines. Double-click any of these and changes as you wish.
John (Merchantprince)
[I]“Nobody can be exactly like me. Even I have trouble doing it.”[/I]
Rui, you know how to find your broker’s folder under the C: drive ?
inside that folder you will have several other folders. One of them is the Experts folder and also one of them is the templates folder. The templates folder is where the .tpl files are stored and I think these are the ones that you create, not the ones that already come with metatrader.
Also inside the experts folder is another templates folder and I think those are the ones that come with metatrader, not the ones that you create.
Merch, if you have winzip, you can put a .tpl file in a zip file and upload it.
i had looked at the both folders and all i can find are the ones that had come with metatrader… the ones i had saved are not there… don´t know why
Guys, custom templates are found in the templates folder in the main directory:
C:\Program Files\MetaTrader 4 emplates
today is almost over and i haven´t made one single trade… the market had strongly trend today and the stochs filter had keep me away from it.
so far so good… but is so boring 
and good news to not european people… this looks like works great at asia opening…
I got the template and indis set up thanks guys 
I had to reload the template after I installed the mtf to get it working.
now the first thing we want to see is the price go out of the dailly channel.
[B]the second thing is the stochs cross one of the levels lines from outside to inside[/B]. that means when it cross the 10 or 20 level line from the bottom to up them we should go long and the oposite to go short.
What time frame are you looking at the stochs on here? When you are looking for entries.
I have not had a chance to do any trading lately but I have been following along and one thing I have been thinking about is how important it is to know when not to trade or when not to use a particular system. This additional “filter” to the already good mmtt system looks like it might be a step in that direction.
edit>> Rui I see the chart you posted is a 1 hr chart is that what you are looking at? I also read you think many of these setups might happen during the Asian session That got me interested as that is the time I can be at the charts the most.
Shr1k
What setup are you using in your MTF to get the 3 (square looking) lines?
What time frame is the chart?
Thanks
I see the TF is H1
any one would like to try to make a EA out of this system… with the new filter most of the good setups appear during my sleeping time and i´m not liking it…
Hi Rui,
Thanks for the update on the system. Really looking forward to trading with the MMTT again.
One question - with the stochs now, we don’t look at higher low and lower highs anymore?
updates? hmmm
ok… i come here to admite that the new filter sucks:(
since i´d being trying to find a filter that could increase the win ratio of this system my account haven´t grow one single dollar…
and since i start to use the new stochs filter i´ve being losing more than i win… and so i´m now with a shamefull 3% drawdown in my beloved account…
i just want to say that i´ll back to the old simple system that i´ve always being trading with all the losses associated to it , and the constant growing of my account.
i´m back to the higher lows and lower highs in the 5min chart without filters or anything else that is making me not winning like i use to.
still searching for the perfect exit strat but until i found it i´ll do exactly what i´d always do… lose small, win big…
like we use to say around here: a winning team should not be changed
i´m sory for all the time i´ve being out of this thread and i´ll start to post here again for everyone still interest in this system.
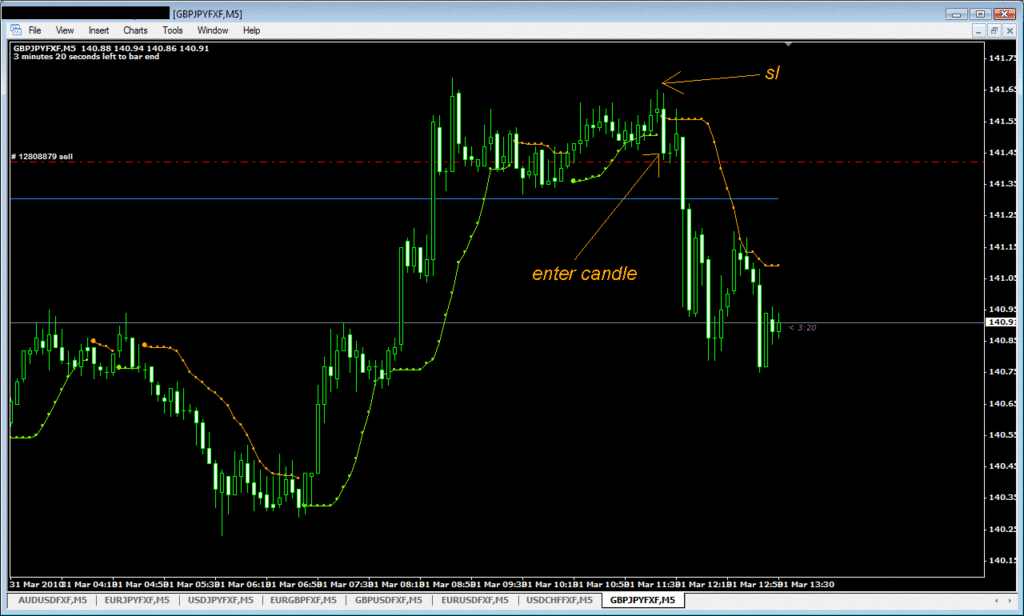
gj trade took on the news… lucky one… i had forget about checking the news… it could have being agains me
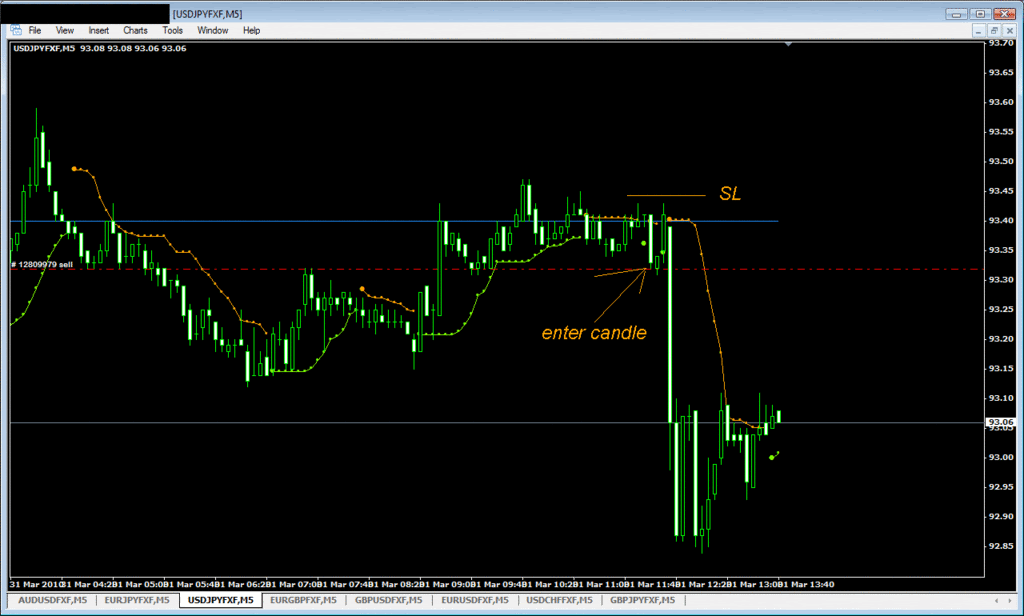
uj… the same as gj… lucky one
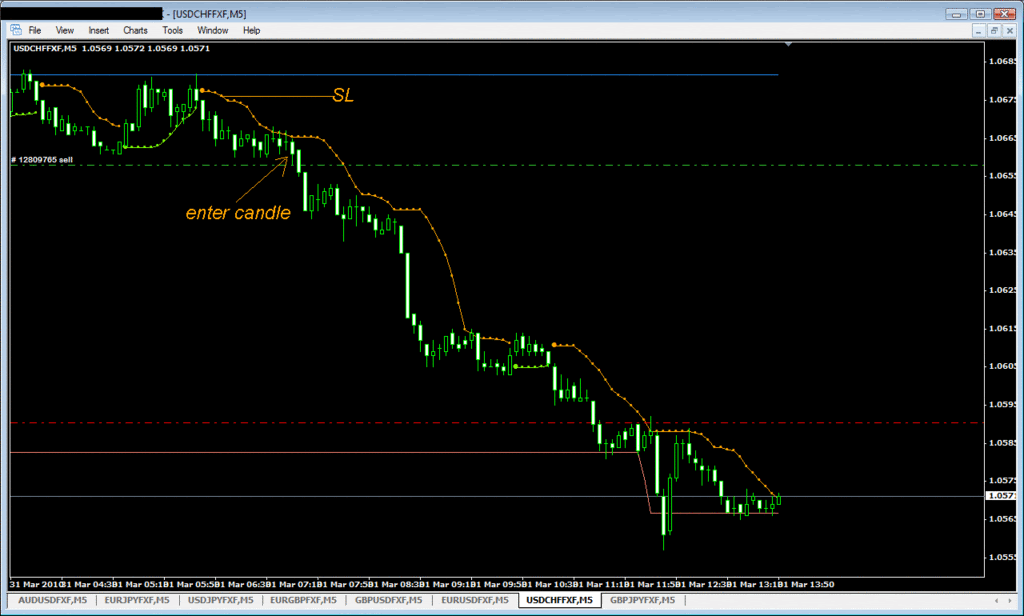
uchf… entered at london open as soon as i awake
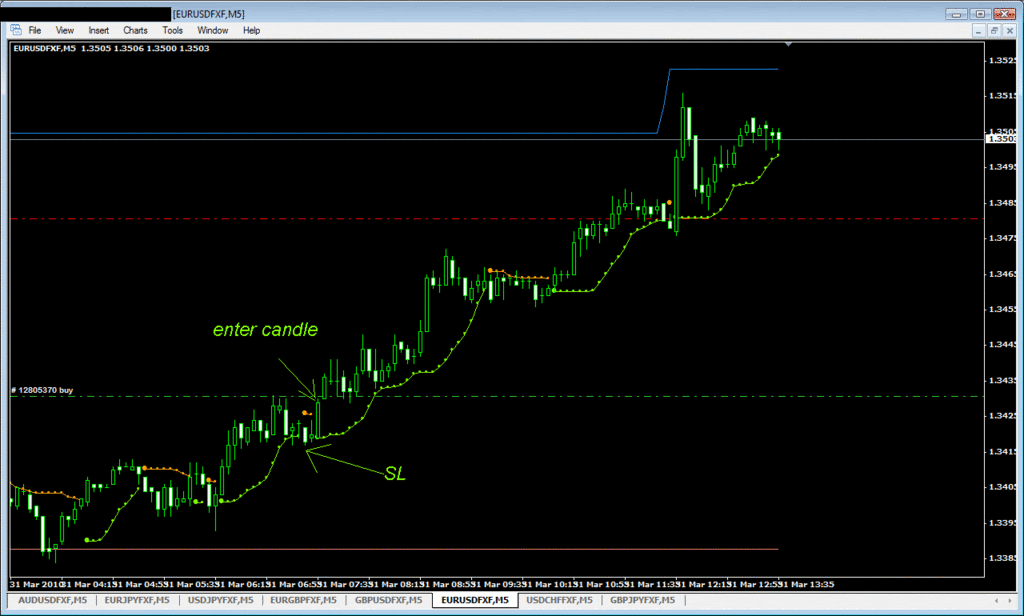
eu… enterd a litle bit later
i´m long in eg too and still waiting to go short in gu
i´m back on track people
hey Rui
I agree with you, if the original simple way works then stick with it.
Just recently I’ve started looking at Pivot points and support & resistance lines. Probably something I should have been doing all along. You might take a look at some simple lines like that for an exit strategy. Exit at price approaches a pivot point or a support or resistance.
here’s a good little video on finding support / resistance starting from the higher time frames and drilling down to the lower time frames
YouTube - How To Find Key Support & Resistance Levels With Top Down Analysis


