The Progress of Alphahavoc III

Im used to traffic jams. Europe is full of them.

1 Like

So nice to see pics. I’d much rather see this than influencers on Instagram!

1 Like

29Jul 2019
0618HR SGT
Symbol : CADJPY
Action : Long
Lot : 0.03
Open : 82.541
Target 82.591
( adjusted to 82.641, manually closed at 82.567 )
Stop: 82.349 ( adjusted to 82.199 )

1051HR SGT
Symbol : CADJPY
Action : Long
Lot : 0.03
Open : 82.426
Target 82.491 ( hit target )
Stop: 82.199

CADJPY head south contrary to what i expected. Anyway, i decided to chip in a second position to sort of average my initial position.

1512HR SGT
Symbol : GBPCAD
Action : Short
Lot : 0.01
Open : 1.62700
Target 1.62399 ( hit target )
Stop: 1.63501

1539HR SGT
Symbol : GBPCAD
Action : Short
Lot : 0.01
Open : 1.62705
Target 1.62569 ( hit target )
Stop: 1.63501

Laksa, meal of the day.

All position closed.
Account current net gain :
[(1062.42 - 1007.62)/1007.62] x 100%
= 5.4%

2210HR SGT
Symbol : USDJPY
Action : Long
Lot : 0.03
Open : 108.650
Target 108.751 ( hit target )
Stop: 108.499

Since last Monday, USDJPY have been on a clear bullish trajectory. In the current US session, a breakout above Asian session High just occurred, demonstrating strong buying pressure. IMO, a test of Daily R1 level is indicated. Daily S1 level would serve as an immediate support level.

2233HR SGT
Symbol : EURUSD
Action : Short
Lot : 0.01
Open : 1.11286
Target 1.11199 ( target cancelled )
Stop: 1.11401 ( adjusted to 1.11501, stop cancelled)

0110HR SGT
Symbol : EURUSD
Action : Long
Lot : 0.01
Open : 1.11419 (hedged with previous EURUSD short with floating loss about 13pips)

For EURUSD, Friday’s daily High Low shrinked. Today’s daily HL range is even more pathetic, suggestive of ranging conditions. Price largely traded below daily Pivot level, illustrating that there still more seller than buyer as per se. Although a retracement breakout above daily R1 level cannot be ruled out, i’m inclined to take a short trade as i believe price is still making attempts to test daily S1 level.

2 Likes

Nice to know that you’re back! :slight_smile:

1 Like

Trading Day 2 ( 30th JULY 2019 )

CHF is ranked 2nd, with a change in momentum index from -1.4 to +2.2 . JPY is ranked 6th, with a change in momentum index from +1.0 to -2.4 . My take is for CHFJPY to continue in its bullish rampage.

Technically, CHFJPY is hovering just above daily open and bouncing off 120MA, suggestive of trend continuation once Tokyo session open.

0716HR SGT
Symbol : CHFJPY
Action : Long
Lot : 0.03
Open : 109.745
Target 109.901 ( cancelled )
Stop: 109.499 ( cancelled )

1241HR SGT
Symbol : CHFJPY
Action : Short
Lot : 0.03
Open : 109.494 (hedged with previous CHFJPY Long with floating loss about 25pips)

Update of current positions

Current equity net loss
[(1007.62-1003.64)/1007.62] x 100%
= -0.39%

1305HR SGT
Symbol : CHFJPY
Action : Short
Lot : 0.06
Open : 109.507
Target 109.409 (struggling to hit target)
Stop: 109.801

2100HR SGT
Symbol : CHFJPY
Action : Short
Lot : 0.06
Open : 109.683
Target 109.619 (Hit Target)
Stop: 109.761

Point of control (POC) between 109.30 - 109.70
Reason for 2100HR SGT CHFJPY Short trade, CHFJPY market ranging conditions, speculating on a bounce off 109.70

TPO ZOOM

Zooming in TPO : LMNOQ provides a level of immediate support at 109.55. A breach below 109.55 may tumble CHFJPY down to test POC support zone at 109.30 - 109.40

2320HR SGT
Symbol : CHFJPY
Action : Short
Lot : 0.06
Open : 109.655
Target 109.609 (hit target)
Stop: 109.761

1 Like

Trading day 3 ( 31JUL2019 )

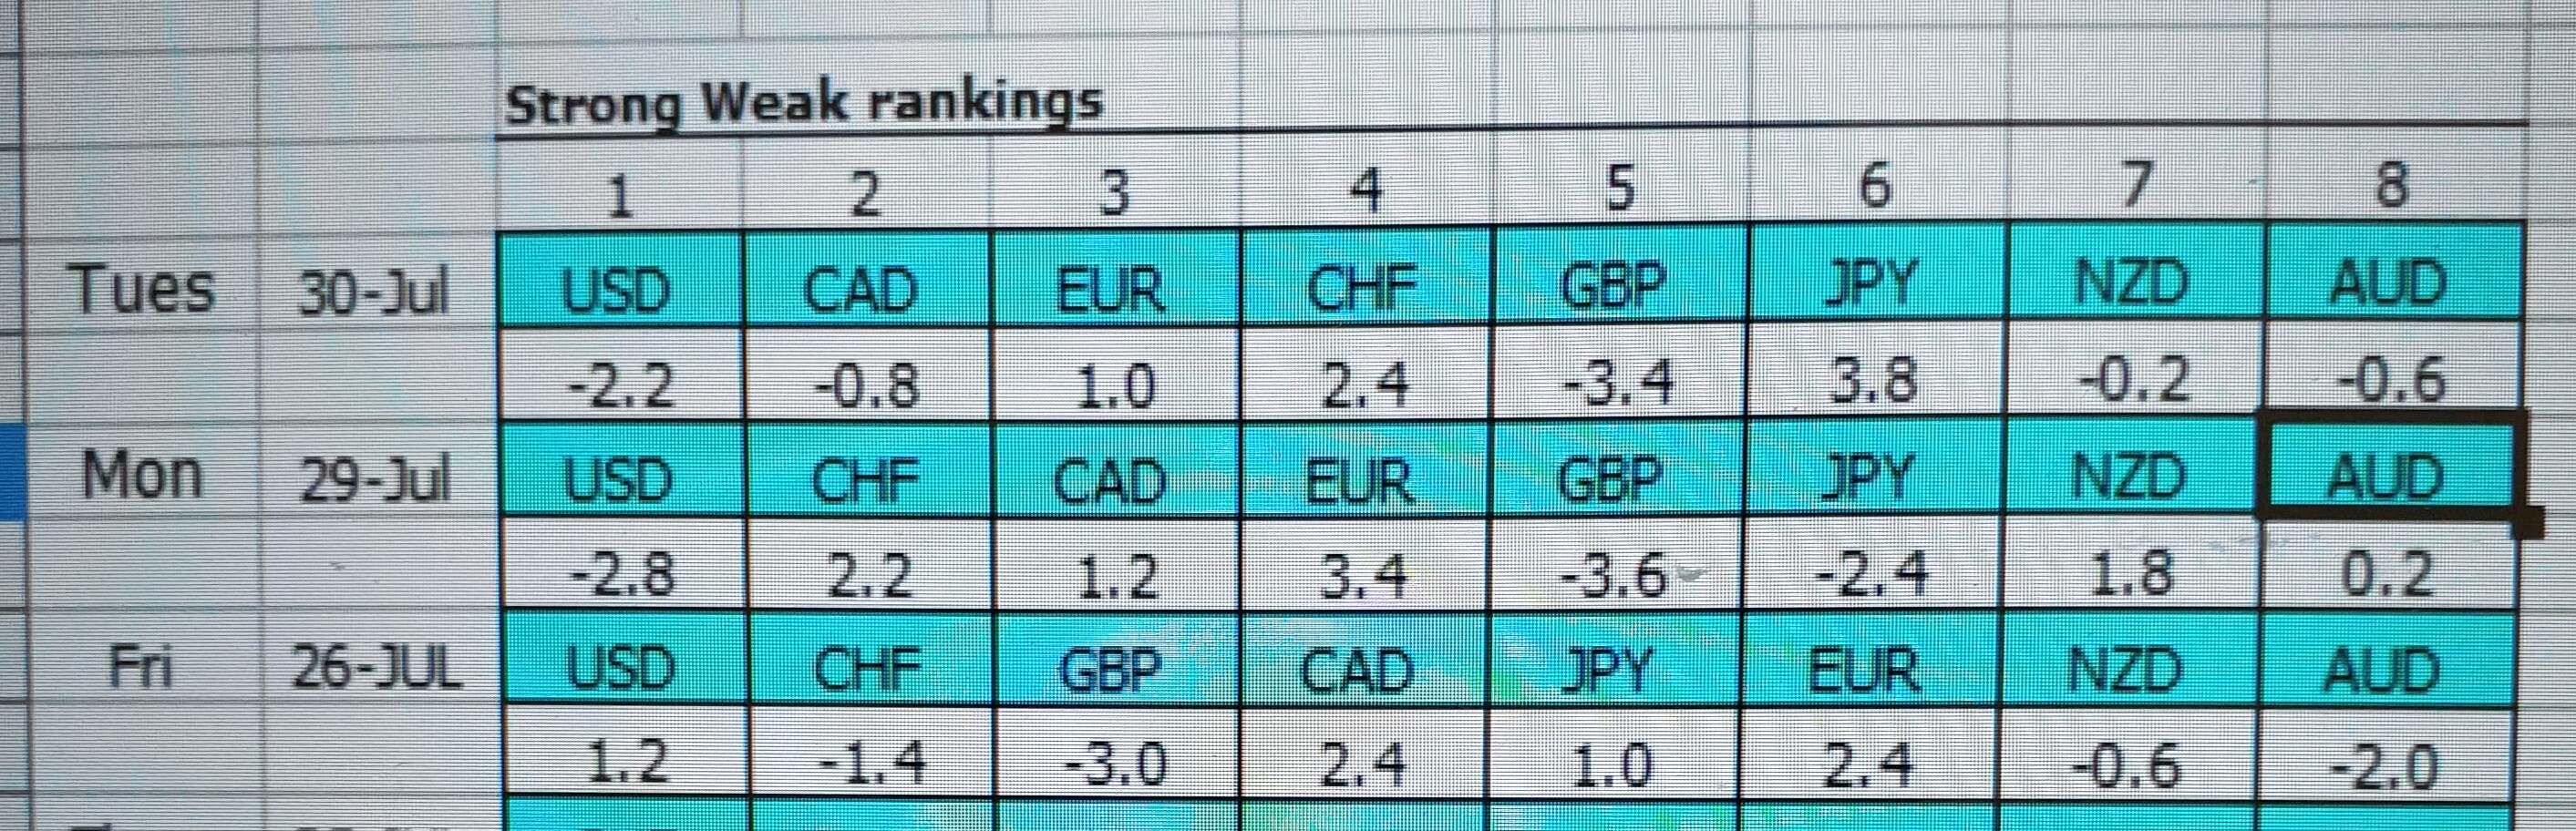
According to my latest SW ranking, CHF dropped from rank 2 to rank 4, but momentum index is showing still showing signs of strength. Which means, CHF is being dwarfed and sandwiched by other major currencies, directionless.

For JPY, it is still holding its ground at rank 6, with a significant increase in net momentum index. Giving hints of forthcoming ascent.

Which is sort of a good news for my Short CHFJPY from yesterday.

TPO charts showed that the trading range narrowed to between 109.30 - 109.70 , with price bouncing off 109.70 and heading towards lower border of range at 109.30.

Interestingly, POC zone yesterday and value area are exactly the same, within 109.60 - 109.70 , deplorably tight. Price breached yesterday’s lower border of value area 109.55 , which IMHO is sellers initiation of short selling.

Overall, CHFJPY is skewed towards the downside due to the rising strength of Yen, with likelihood of being supported by Friday’s POC level at 109.30

Member Spotlight :slightly_smiling_face:

30JUL2019
1305HR SGT
Symbol : CHFJPY
Action : Short
Lot : 0.06
Open : 109.507
Target 109.409 (adjusted to 109.469, manually closed at 109.483)
Stop: 109.801 (adjusted to 109.901)

Last of my open position finally closed out in the green. I’m satisfied now. The remaining open position are in perfect hedge. One EURUSD hedged with floating loss of about 13pips. One CHFJPY hedged with floating loss of about 25pips.

I decided to temporary pause my trading and do some trade review. Reason being, FOMC interest rates decision is just on the horizon. Adding fuel to fire, another NFP monster lurks just around the corner. I reckon it would be wise not to get tangled up with these two mobster.

Late lunch at McDonalds

Happy Trading everyone!
Plenty of Green pips ahead…

29JUL2019
2233HR SGT
Symbol : EURUSD
Action : Short
Lot : 0.01
Open : 1.11286 ( daily swapped to 1.11300 )
Target 1.11199 ( adjusted to 1.11270)
Stop: 1.11401 ( adjusted to Buy stop order at 1.11701, Changed to 1.11601 )

30JUL2019
0110HR SGT
Symbol : EURUSD
Action : Long
Lot : 0.01
Open : 1.11419
Closed : 1.11459 (manually closed with positive pips)

31JUL2019
2051HR SGT
Symbol : EURUSD
Action : Short
Lot : 0.01
Open : 1.11512
Target 1.11449 (hit target)
Stop: 1.11701 (Buy stop order cancelled)

Although i say to stop trading, boredom got the best of me. I took a look at the chart and feel there might be an opportunity to closed off both the Long and Short trade with positive pips result. My long EURUSD was closed at 1.11459 with a few positive pips. I adjusted the previous Short EURUSD with new targets and stop order. I also make an additional Short scalp entry of EURUSD at price 1.11512, targeting 1.11449

Technically, today is the 3rd day of EURUSD bearish retracement. An hourly candle closed below Daily pivot level during London Open session signal a potential end to the current bearish pullback phase. Price is also steadily treading towards daily S1 price level. Although a breach below daily S1 price level would be a more valid sign that marked the end of the bearish retracement, I decided to go with my gut and make assumption that price will test daily S2 price level.

29JUL2019
2233HR SGT
Symbol : EURUSD
Action : Short
Lot : 0.01
Open : 1.11286 ( daily swapped to 1.11300 )
Target 1.11199 ( adjusted to 1.11270, manually closed at 1.11280)
Stop: 1.11401 ( adjusted to Buy stop order at 1.11701, Changed to 1.11601, buy stop order cancelled )

I finally manage to close both my Long and Short EURUSD position with positive pips. A case of squaring off a hedge that went well. On a side note, i’m lucky to have square off my Short position just before the FOMC interest rate fireworks.

Currently, i only have a remaining Long and Short CHFJPY position to deal with another day.

Current net equity gain
[(1088.98 - 1007.62)/1007.62] x 100%
= + 8.07%

2 Likes

Trading Day 4 ( 1st AUG 2019 )

30 JUL 2019
0716HR SGT
Symbol : CHFJPY
Action : Long
Lot : 0.03
Open : 109.745 (daily swapped to 109.755)
Target 109.901 ( set to 109.785)
Stop: 109.499 ( in hedge with short at 109.494)

30 JUL 2019
1241HR SGT
Symbol : CHFJPY
Action : Short
Lot : 0.03
Open : 109.494 (hedged with CHFJPY Long at 109.755 with floating loss about 25pips)

I haven’t got time to update my TPO chart for CHFJPY, but base on my previous TPO chart, trading range is between 109.30 - 109.70. I’m quite intrigue by how price respected the 109.30 by bouncing up at the moment. I just placed a target for my CHFJPY Long at 109.785 , if i get lucky enough to hit target, i will hold my CHFJPY short down , as i believe CHFJPY will continue to tread lower, base on my previous analysis. However, if my target for Long CHFJPY is not triggered, then it is very likely that i will be holding my Long Short hedge for many days to come.

Early lunch, Ginger onion fish with rice

As we can see from the TPO chart for CHFJPY, price is bouncing back and forth between 109.30 - 109.70 levels.

I was comparing Dennis’s SW vs my SW ranking. Dennis make use of 200MA, which i think gives a longer term perspective when compared to mine. What i’m seeing in Dennis’s SW ranking is this, CHF rose in rank and JPY drop in rank. Whereas in my SW ranking, CHF and JPY have yet to criss cross each other. What does it mean then? That’s the million dollar question. If i can’t deduce the answer, then the SW ranking is pretty much useless. IMHO, i think it probably means that there are more room for CHFJPY to drop further today at least until Friday’s NFP news release. I could be wrong though.

1st Aug 2019
1155HR SGT
Symbol : NZDUSD
Action : Short
Lot : 0.015
Open : 0.65550
Target 0.65399
( adjusted to 0.6552, hit target )
Stop: 0.65901 ( buy stop order cancelled )

1st Aug 2019
2319HR SGT
Symbol : NZDUSD
Action : Short
Lot : 0.015
Open : 0.65654
Target 0.65219
( adjusted to 0.65624, hit target )
Stop: 0.65901 ( buy stop order cancelled )

2nd Aug 2019
0102HR SGT
Symbol : NZDUSD
Action : Short
Lot : 0.03 ( exited 0.015lot at 0.65536 profited about 20pips)
Open : 0.65734
Target 0.65219
Stop: 0.65901 ( buy stop order )

I decided to book some profits and exit 50% of my NZDUSD Short position. Now, i’m left with 0.015 lot of NZDUSD in progress, hopefully will hit my desired targets early.

30 JUL 2019
0716HR SGT
Symbol : CHFJPY
Action : Long
Lot : 0.03
Open : 109.745 (daily swapped to 109.755)
Target 109.901 ( set to 109.785, targets cancelled)
Stop: 109.499 ( in hedge with short at 109.494)

30 JUL 2019
1241HR SGT
Symbol : CHFJPY
Action : Short
Lot : 0.03
Open : 109.494 (hedged with CHFJPY Long at 109.755 with floating loss about 25pips)

I reviewed my CHFJPY Hedged trade and had my targets removed from my Long position. When can i release the hedge will depend on NFP tonight, if NFP show signs of reversal, I might be able to release the hedge somewhere next week. However, if the bearish run continue, it would probably take weeks before there is any opportunity to release the hedge.

Above is a screenshot of my current position in progress.

2 Likes

Trading Day 5 ( 2nd Aug 2019 )

2nd Aug 2019
0102HR SGT
Symbol : NZDUSD
Action : Short
Lot : 0.03 ( exited 0.015lot at 0.65536 profited about 20pips)
Open : 0.65734
Target 0.65219
( manually closed at 0.65549)
Stop: 0.65901 ( buy stop order cancelled)

According to my SW rankings, USD remain at 2nd placing but momentum index has weaken slightly. NZD have drop from rank 6 to rank 7, momentum index is not showing signs of weakening. A possible retracement phase for NZDUSD before bearish run resume? I really don’t know. Furthermore, tonight is NFP, most market participant may choose to adopt a wait and see attitude, with the exception of the longer term position trader and intraday long shot speculator. Thus, i choose to liquidate my remaining NZDUSD position.

With respect to the SW rankings, EUR remain at rank 1 and momentum index show a significant increase from -3.8 to 0 . Although GBP rose in rank, momentum index show an even larger drop from 4.6 to -1.4 .

In the early Asian sessions, price broke Daily R1 demonstrating bullish sentiments. A further test of daily R2 level may be highly possible IMO.

2nd Aug 2019
1432HR SGT
Symbol : EURGBP
Action : Long
Lot : 0.03
Open : 0.91494
Target : 0.91541 (hit target)
Stop: 0.91349

2nd Aug 2019
1116HR SGT
Symbol : EURGBP
Action : Long
Lot : 0.01
Open : 0.91480
Target : 0.91651
( manually closed at 0.91497 )
Stop: 0.91199 ( sell stop order cancelled )

During the London session open, EURGBP was unable to climb higher than Asian session High. Market participant are probably wary of tonight’s NFP. In any case, i’m calling it quits. My EURGBP is manually closed at 0.91497. Playing it safe, i want to avoid NFP altogether.

Weekend Contemplation

think

SW 04aug2019

" RBA Cuts Cash Rate Again to Fresh Record Low of 1%
The Reserve Bank of Australia lowered its cash rate by 25 bps to a new record low of 1.0 percent at its July meeting, as widely expected. It is the first back-to-back cut in borrowing cost since 2012, aiming to support employment growth and to provide greater confidence that inflation will be consistent with the medium-term target. The Committee said they will continue to monitor developments in the labour market and adjust monetary policy if necessary. "

Excerpt from the statement by the governor, Philip Lowe:


CHINA EXPORTS

" Australia’s dependence on Chinese money has been a blessing for the local economy, but it could unravel painfully if China’s economic slowdown worsens.

Key points:
Australia’s biggest exports are iron ore and coal, worth $120b (or 30pc of goods sold overseas)
The nation’s largest export markets are China (31pc), Japan (13pc) and South Korea (6pc) "

By business reporter David Chau
Australia’s fortunes are linked to China’s economy

Hey please how do I get this your strong weak ranking, weekly report

Go thru this thread, find out how the SW ranking is constructed, and understand how Dennis interpret his own chart.

Then use your own creativity, modify Dennis SW model to suit your own trading DURATION. Play with various different Moving averages, 1hr, 4hr, daily & weekly candle.

Take note of NET CHANGE between … ? COMPARE your own personally developed SW rankings versus the price chart. BACK TEST, FORWARD TEST, with your own trading STYLE, methodology you are able to understand and execute with EASE.

I have a superstition. When you share the exact construct of your own SW ranking with others. It will start to fail. You will bombarded with the “WHYs.” Your faith will be challenged.

In trading, make ASSUMPTIONS and TEST it. When at 1st you don’t succeed, try harder the next time round. You only REALLY fail when you give up.

You must understand that 2 different MMA fighter using the SAME exact martial arts technique can yield COMPLETELY different results. The one who wins is only because of TIME, EFFORT and FLAIR.

PS : If you are not prepared to die trying, most probably you won’t succeed. ALL athlete have tremendous amount of desire to keep them moving forward.

1 Like

Building a slide

3 Likes

Trading Day 6 ( 5 Aug 2019 )

SW 04aug2019

In anticipation of the forthcoming cash rate decision by RBA. My over the weekend contemplation on the fundamentals for AUD was a bearish one. From my SW rankings, although AUD rank 1st, momentum index was rather weak as there were at least 3 other Major currencies with momentum index stronger than the AUD. I am incline to take a bearish stance on the outlook for the AUD this week.

5th Aug 2019
0644HR SGT
Symbol : AUDJPY
Action : short
Lot : 0.01
Open : 72.458
Target : 72.199 (hit target)
Stop: Nil (no stop in place)

5th Aug 2019
0644HR SGT
Symbol : AUDJPY
Action : short
Lot : 0.01
Open : 72.458
Target : 71.919 (hit target)
Stop: Nil (no stop in place)

Technically, it would be unthinkable to buy into AUDJPY at the moment. At present, i really don’t know where to place my stop loss, thus i’m not putting any stop order in place.

5th Aug 2019
0840HR SGT
Symbol : AUDJPY
Action : short
Lot : 0.01
Open : 72.326
Target : 71.199 (hit target)
Stop: Nil (no stop in place)

I’m off to a great start for the week. During the early part of the Asian session, all of my AUDJPY hit target promptly.

5th Aug 2019
0644HR SGT
Symbol : AUDJPY
Action : short
Lot : 0.01
Open : 72.458
Target : 71.919 (hit target)
Stop: Nil (no stop in place)

Technically, it would be unthinkable to buy into AUDJPY at the moment. At present, i really don’t know where to place my stop loss, thus i’m not putting any stop order in place.

5th Aug 2019
0956HR SGT
Symbol : EURGBP
Action : short
Lot : 0.01
Open : 91.432
Target : 91.219 ( downgrade to 91.399 )
Stop: 91.611 ( buy stop at 92.301 )

5th Aug 2019
1006HR SGT
Symbol : EURGBP
Action : short
Lot : 0.01
Open : 91.482
Target : 91.419 ( downgrade to 91.399 )
Stop: 91.611( buy stop at 92.301 )

5th Aug 2019
0947HR SGT
Symbol : EURGBP
Action : short
Lot : 0.02
Open : 91.544
Target : 91.489 ( downgrade to 91.399 )
Stop: 92.201 ( buy stop at 92.301 )

5th Aug 2019
1629HR SGT
Symbol : EURGBP
Action : short
Lot : 0.04
Open : 91.842
Target : 91.709 ( hit target )
Stop: 92.301 ( buy stop order )

Always so refreshing to read your journal @alphahavoc. Haha. :smiley: I’m now thinking of including photos in my journal too. :thinking: Haha. Anyway, good luck to us this week! :blush:

1 Like

I agree! I enjoy visiting his thread because of the pictures. :smiley:

1 Like

5 Aug 2019
1759HR SGT
Symbol : EURGBP
Action : Short
Lot : 0.08
(All positions merged into one big position)
Open : 91.678
(Averaged price level of merged positions)
Target 1 : 0.04lot buy limit order at 91.668
Target 2 : 0.04lot buy limit order at 91.519
Stop : 92.301 ( 0.08lot buy stop order )

All of my EURGBP positions are making me dizzy. I decided to just merge all of them into one big position, so that i can see where my average position is at. I’m aiming to square off 50% at 91.668, leaving the remaining 50% to take a stab at 91.519 .

5 Aug 2019
1759HR SGT
Symbol : EURGBP
Action : Short
Lot : 0.08
(All positions merged into one big position)
Open : 91.678
(Averaged price level of merged positions)
Target : 91.668 (adjusted as a take profit order)
Stop : 92.301 (adjusted as a stop loss order)

After receiving a private message from a kindred spirit from Babypips. I decided to go on the defensive. My intraday analysis was right, but i had sub-optimal management of my positions. Price broke out above 91.60. That was my initial stop loss price, the price level which in my opinion should hold, and if not i should get out.

However, that was a direct conflict against my SW rankings forecast, which IMO EURGBP should go down. Thereafter, i decided to move my stop loss further away and held on to my SW ranking forecast belief that price will go down.

Basically, i have this bad habit of refusal to accept that the SW ranking can have its limitation, and that i’m wrong. A kind of denial attitude.

Right now, at the present moment, i’m already committed. Thus, it make no sense to cut loss at whatever level price it is right now. Furthermore, current price is tanked at the upper limits of average daily range. It is a do or die situation, i simply have to take a stand. There is a high probability that price will reach at least 91.668.

I believe the mistake made here was not cutting loss when price broke 91.60 . Now the decision to aim for 91.688 is all in all a brand new trade altogether. I’m going for it, and a Stop loss is set in stone at 92.301 .

Regardless of whether i get this oversized trade right or wrong, moving forward, i will remember today’s lesson.

  1. Didn’t cut loss when my stop loss level is breached
  2. Inappropriate adding of positions to average,i need to make more timely and accurate price averaging (must be of significant distance before averaging, otherwise risk overexposure of margin due to an oversized position)
  3. Really need to further downsize my initial trade position.

A bitter pill to swallow . . .

3 Likes

Trading Day 7 ( 06 Aug 2019 )

A walk in the park…


A guy catching pokemon and a girl jogging.

Drive thru McDonald

5 Aug 2019
1759HR SGT
Symbol : EURGBP
Action : Short
Lot : 0.08
Open : 91.678
Target : 91.668 ( manually closed at 91.738 )
Stop : 92.301 ( cancelled and set at $500 equity balance )

6th Aug 2019
2152HR SGT
Symbol : USDJPY
Action : short
Lot : 0.01
Open : 106.515
Target : 106.299 ( hit Target )
Stop: 106.711

By some divine intervention, i miraculously survived the drawdown with my EURGBP trade. So much for my stop loss set in stone at 92.301 , i started with $1007, and when the drawdown was close to 91.301, i was down to about $700 - $800, i can’t exactly remember how much. I was too incapacitated to act. I gave it the ultimatum of half my initial equity balance at $500. My maximum drawdown was close to equity balance of $523. I probably could only afford a further 2 to 3 pips drawdown till lockdown of my account at $500. I was saddled with utter disappointment and about to give up.

Then a miracle happened, by the combine power of all my babypip fans, All of you must have prayed for me. Price reversed and i managed to get out at 91.738. For the 1st time in all of my 7 years trading experience, i actually manage to scrapped thru a mismanaged trade. Previously, i have never once survived a screw up.

Providence have endowed me with a second chance. I will definitely treasure it. By the way i have also closed my CHFJPY long and short. It is delusional to think that i will be able to unhedge it and price will move back to breakeven level.

3 Likes

you eat mcdonalds a lot :rofl:

2 Likes

+1 for the cat costume

Trading Day 8 (07 Aug 2019)

7th Aug 2019
0817HR SGT
Symbol : GBPUSD
Action : Long
Lot : 0.01
Open : 1.21794
Target : 1.21941 (downgrade to 1.21901)
Stop: 1.21489 (hit stop loss)

A scalp trade
7th Aug 2019
1002HR SGT
Symbol : GBPUSD
Action : Long
Lot : 0.01
Open : 1.21776
Target : 1.21801
Stop: 1.21699 (hit stop loss)
( price consolidating on the 1min chart, took a stab at 1.21831)

7th Aug 2019
1035HR SGT
Symbol : GBPUSD
Action : Long
Lot : 0.01
Open : 1.21652
Target : 1.21801
Stop: 1.21489 (hit stop loss)

7th Aug 2019
1035HR SGT
Symbol : GBPUSD
Action : Long
Lot : 0.01
Open : 1.21644
Target : 1.21691 ( hit target )
Stop: 1.21489

7th Aug 2019
1039HR SGT
Symbol : GBPUSD
Action : Long
Lot : 0.02
Open : 1.21605
Target : 1.21651 (hit target)
Stop: 1.21489

Base on my SW rankings, my intraday directional outlook for GBPUSD is bullish. Thus, i took a couple of contrarian averaging trades with stop loss at Early Asian session’s Low. If that price level doesn’t hold, i’m biting the bullet.

At current point of analysis, price is still trading above Asian session High price. My assumption for GBPUSD is to form a daily close up candle today

7th Aug 2019
1434HR SGT
Symbol : USDJPY
Action : Short
Lot : 0.04
Open : 106.218
Target : 106.019(hit target)
Stop: 106.701

It seems that i may be wrong about GBPUSD. Price took down Asian session Low. I’m cutting loss. I change my focus to USDJPY.

By means of Raw price action using daily candlestick. Tuesday candle form a open wedge formation, breaching Monday High and Low, showing mixed signal. However, on close scrutiny, the top wick for Tuesday candle was longer than the bottom wick, thus showing that selling pressure may be slightly stronger at the moment. Furthermore price is trading below daily open, thus my impression is for USDJPY to form a close down daily candle.

7th Aug 2019
2239HR SGT
Symbol : GBPUSD
Action : Short
Lot : 0.01
Open : 1.21562
Target : 1.21419 (hit target)
Stop: 1.21711

7th Aug 2019
2245HR SGT
Symbol : GBPUSD
Action : Short
Lot : 0.01
Open : 1.21622
Target : 1.21519 (hit target)
Stop: 1.21711

Technically, price breached daily S1 just before US session open demonstrating bearish strength. At present, price is trading just below pivot level, and the underlying assumption here is for GBPUSD to form a close down daily candlestick pattern.

7th Aug 2019
2349HR SGT
Symbol : GBPUSD
Action : Short
Lot : 0.01
Open : 1.21586
Target : 1.21519 (hit target)
Stop: 1.21711