Decided against PM so folks can fact check this or correct if needed:
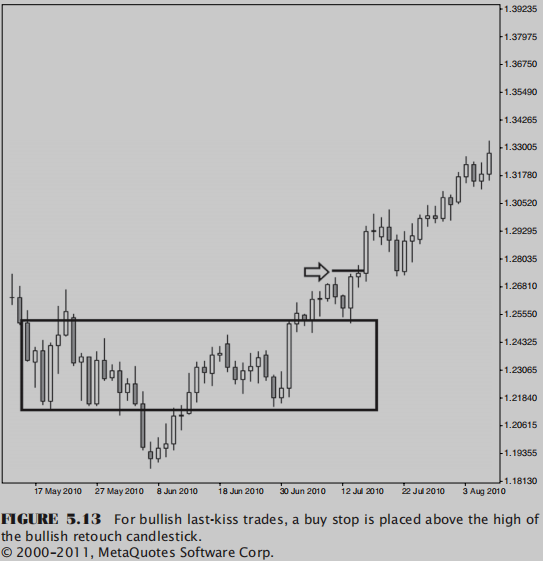
The best I can explain it in trading terms is as follows, with an example. Conventional TA and possibly price action (haven’t read enough yet) recommend waiting for a retracement to previous resistance before buying into a breakout. This is a recommended high probability trading setup.
Source - p.87, Naked Forex: High Probability Techniques for Trading without Indicators

Assumed scenario:
You backtest this idea and find that you have a win-rate of 70% over a 200 trade sample. Forward testing also yields similar results which is when you decide to include it in your tool-kit.
A similar situation, in my opinion, to what you’re facing is you’re seeing trades go in the intended direction (upward in screenshot) without that retracement. You remember recent trades and easily pull up 5 recent examples you’ve seen. This compels you to change your strategy because you’re missing out easy pips on the upward moves now.
This would be an incorrect decision (to change strategy because of a recent high volume) without testing that breakout for a similar sample size. Despite it failing only one rule (that it didn’t retrace) doesn’t warrant changing course all of a sudden. The change in that one rule makes it a new setup, which warrants backtesting and quantifying it.
The sideways arrows indicate the false breakouts. Source - p.85, Naked Forex: High Probability Techniques for Trading without Indicators

Although conventional reading recommends strongly against taking such trades, you might find it a very relevant setup against certain pairs during certain market conditions. Only backtesting/forward testing with a relevant sample sizes will determine this for sure.
I don’t believe this is a foreign concept to traders. Thomas Bulkowski’s attempted to determine similar statistics on chart patterns in his book. Here’s an excerpt from Technical Analysis: The Complete Resource for Financial Market Technicians that explains this concept:
Source - P. 308, Technical Analysis: The Complete Resource for Financial Market Technicians, 2nd Ed.
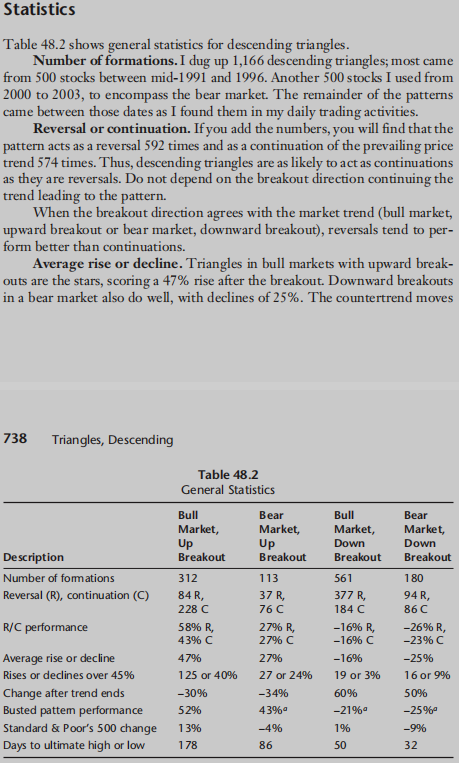
Here’s an except of his findings against descending triangles:
Source - P. 737, Encyclopedia of Chart Patterns, 2nd Ed.

How Poker helps quantify similar situations:
Poker uses probabilities to guide players into making correct decisions based on incomplete information (very similar to trading IMO). They use a concept called Expected Value (EV) to help determine whether the decision to bet, raise or fold in certain situations was correct or not. The video does a good job explaining the simple math and why it’s important for long term poker success:
Going back to the numbers from the breakout scenario on top. If you determine a minimum 3R return on that win-rate in your testing. The numbers are as follows:
EV = [0.70 x 3R] - [0.30 x 1R] = 2.1R - 0.3R = 1.8R
If you’re R = 15 pips then that translates to an EV of 27 pips per trade. What this means is that even if you have 5 consecutive trades go against you (loss of 5R) you grade each of those losses instead with a positive EV score of 1.8R (gain of 9R).
Disclaimer: I haven’t applied this statistical approach to my trading yet honestly speaking. Better to admit it than pretend to be holier than thou. Because I’m new myself my primary focus so far has been expanding my knowledge base as quickly as possible (still very lacking IMO) and routine building/discpline. I’m setting up the groundwork to enable this analytical approach going forward.


