Yes exactly How I see it is, moving a big position through different crosses makes the most sense in order to fill the orders at best prices, which give rises to the correlation. This can present more opportunities to the trader;
Bet on both pairs - depending how good the set up is (Richard Krivo does it all the time)
Split the risk
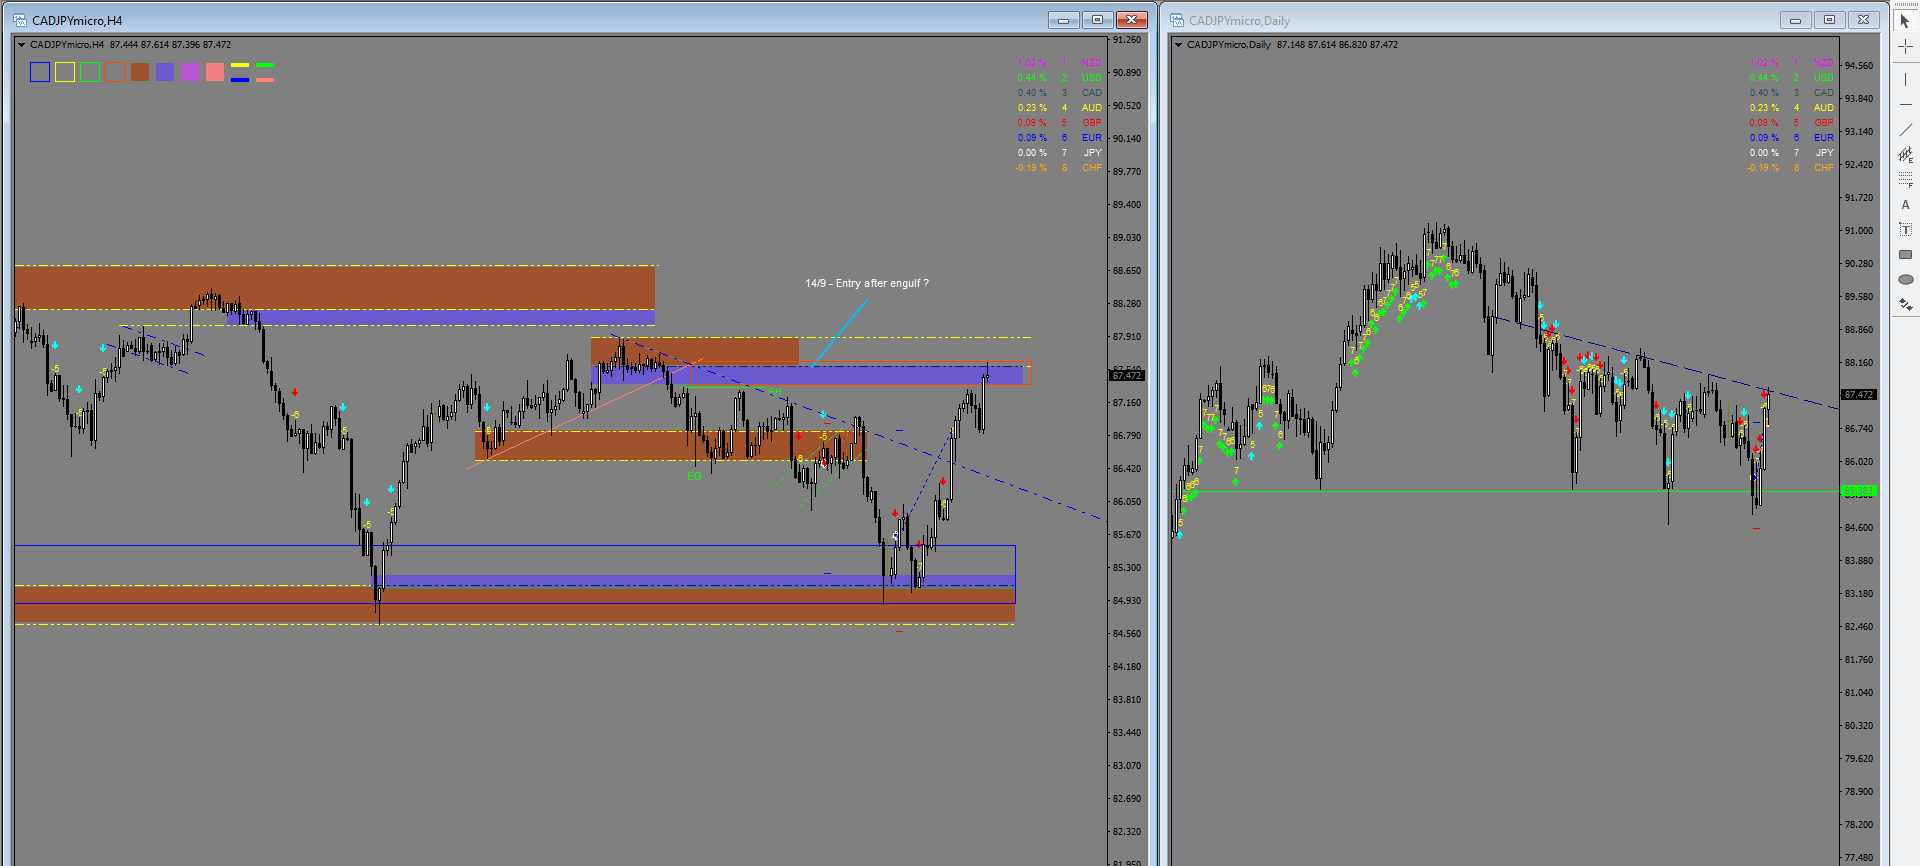
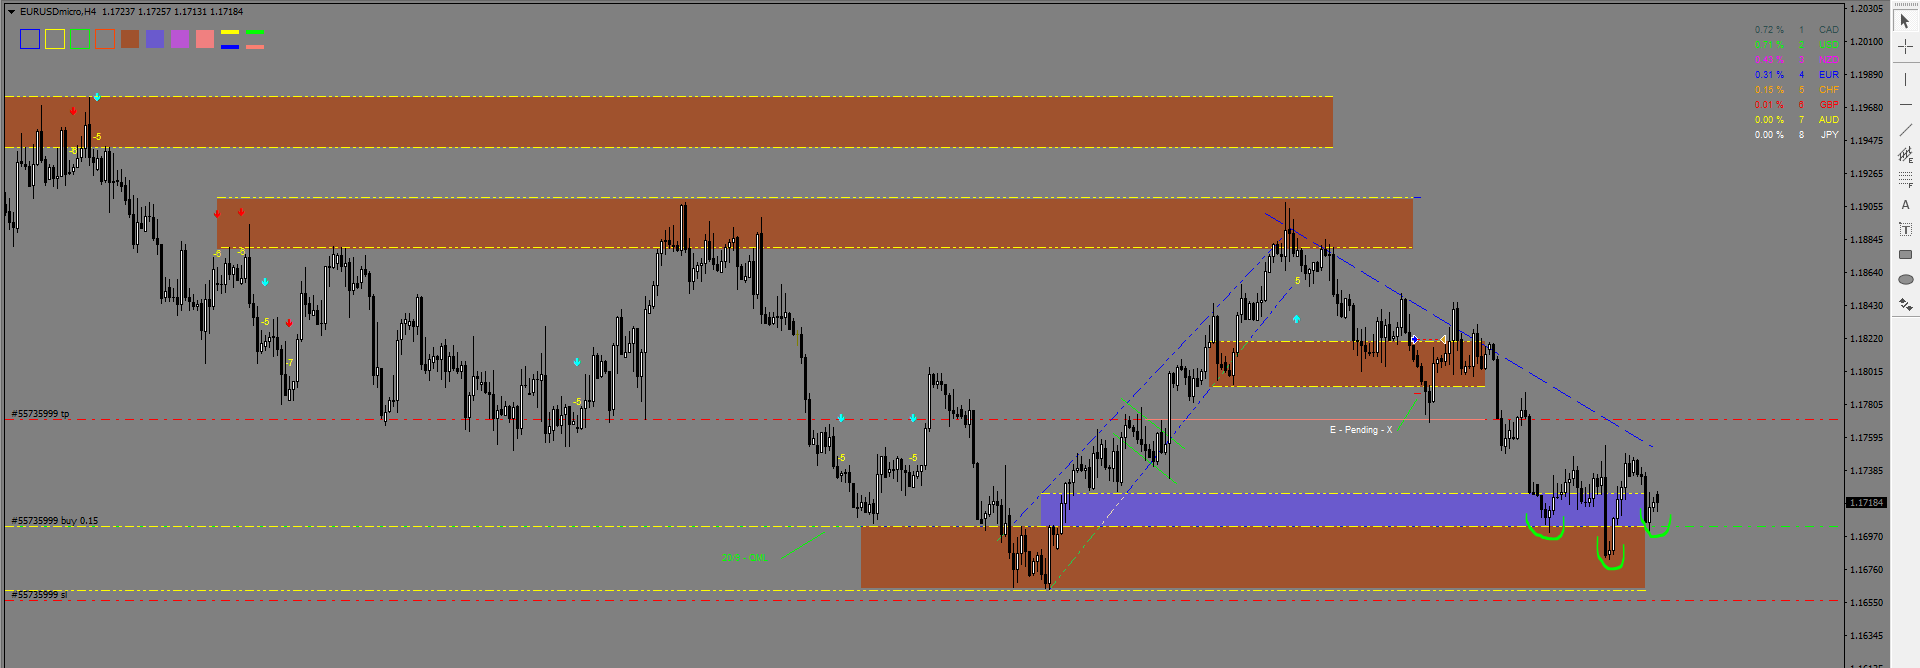
Use the correlated pairs as a leading or lagging indicator (Entry, Profit taking and key reversal areas)
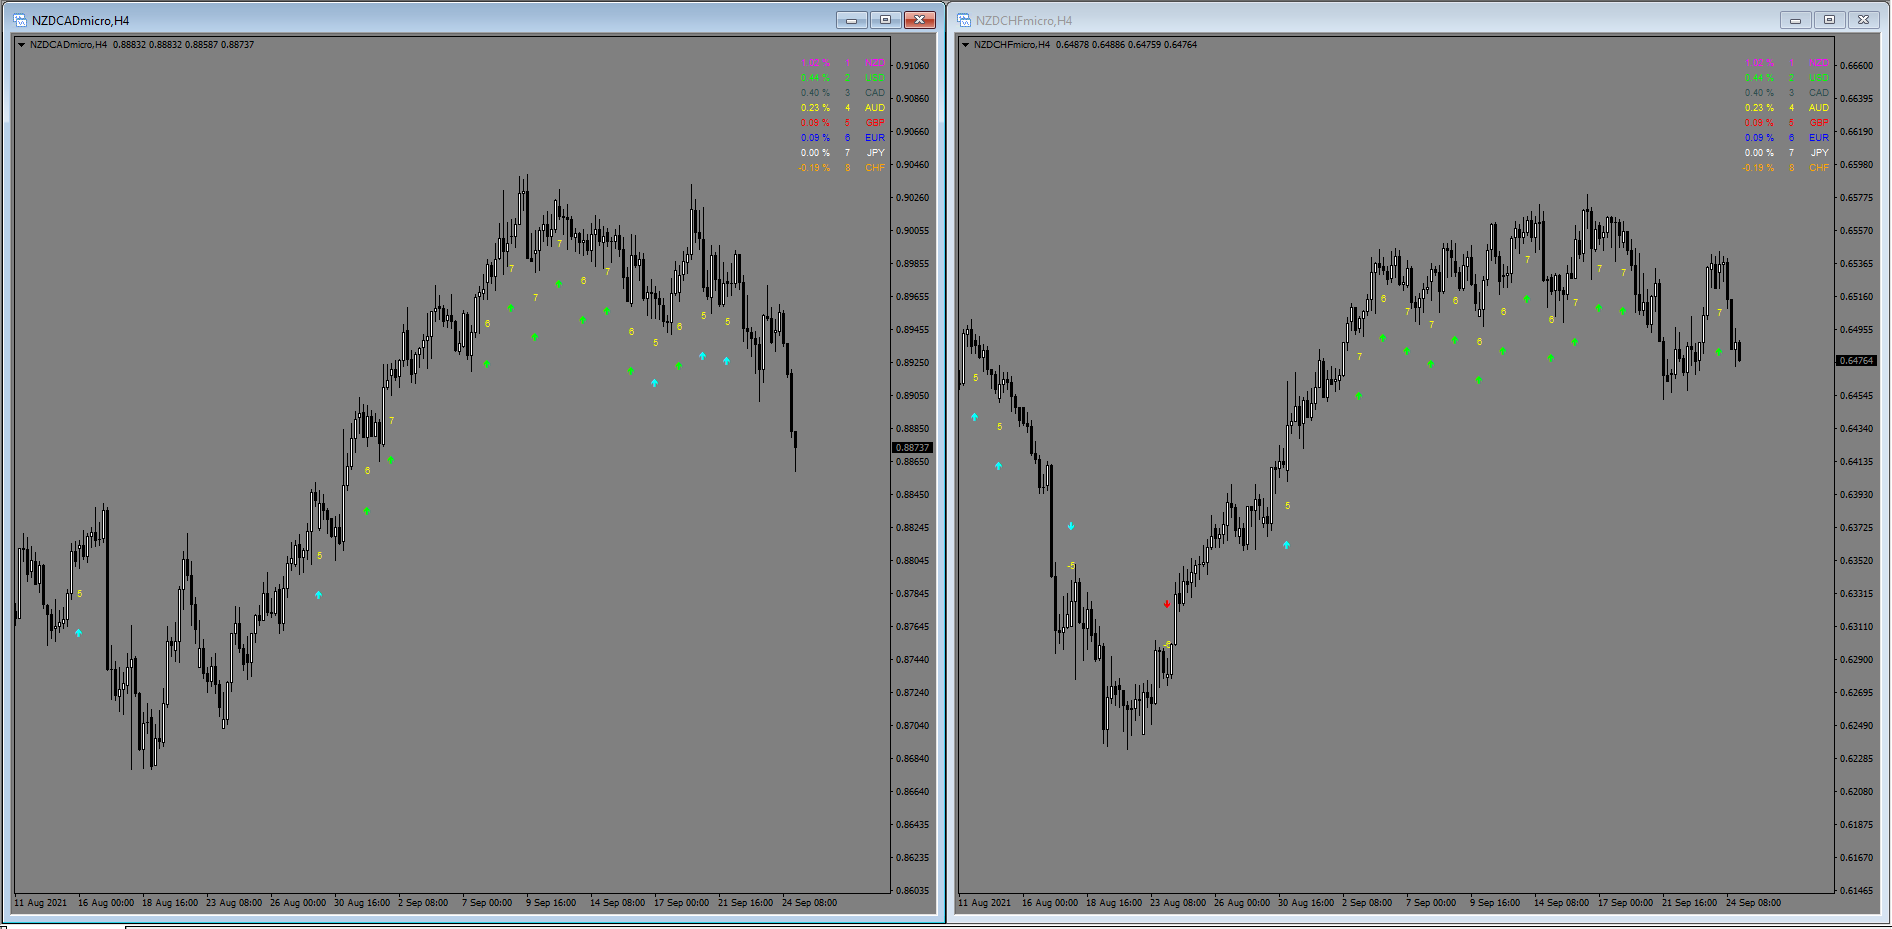
How I spot these pairs - Daily SW values are fed into a correlation formula over a 5.5 period, and these Red (sell) and Green (buy) clusters helps me to figure out the pairs that the huge volumes are moved
Mostly I use Dennis’s values but since we are with different brokers position of the values slightly differ.
How I get my Daily SW values;
27 Aug - Position 1 is CHF and Position 8 AUD. Since AUD is the weakest and CHF is the strongest I do 1-8 = -7
So the value of AUDCHF becomes -7. Number 7 means that is the strongest pair for that day, and (-) indicates the direction that I should be trading this pair.
26 Sep - NZD (1) & CHF (8) - Hence NZDCHF gets = +7 (7 indicates strongest pair and + is the buy direction)
Then I take these values and feed it through a formula to smoothen the noise. And now when I look that color clusters shows me the truly trending pairs and which are correlated.
P.S. - You don’t need these fancy stuff to trade to be honest - all you need is a line.
I am pretty good with excel and my 9-5 is on excel and putting things in this order helps me to visualize the market. One trader said “What if we take things that work in other fields and apply to the market and see what it spits out?” hence in here I am applying what I am good at.
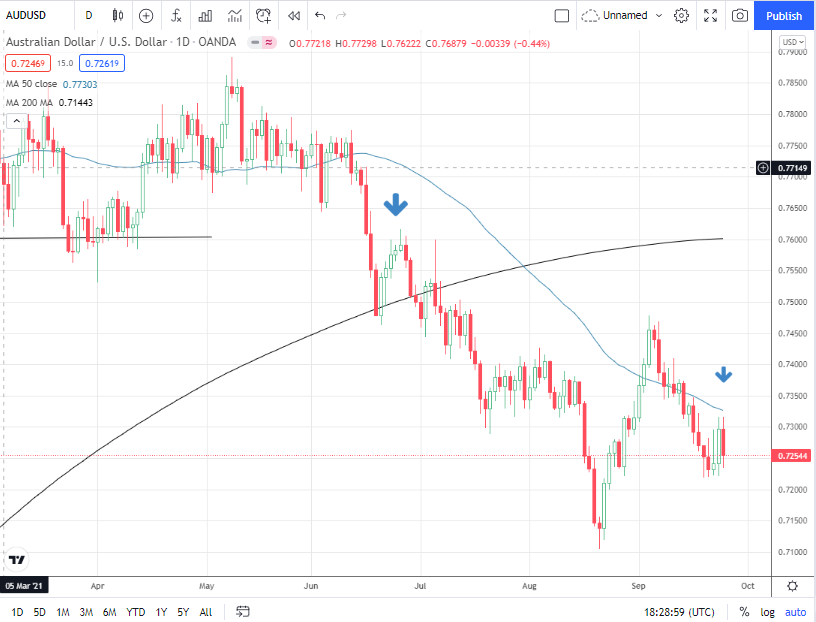
A down Friday for NZD allowed USD to claim the #1 spot, Now looking at AUDUSD as our Current SW leader, we see this may be a continuation of the signal from June. As this is one of the pairs I trade I will be looking to take a new position later today
Look at how tight this market is, any one of the Eight could be #1 this time tomorrow. This all works against our SW trades as our trends are weak and short-lived.
Dennis, your observation is right. That explains why my top trade would be short AUD/NZD (still), then short AUD/USD or short GBP/NZD (where did that one come from?).
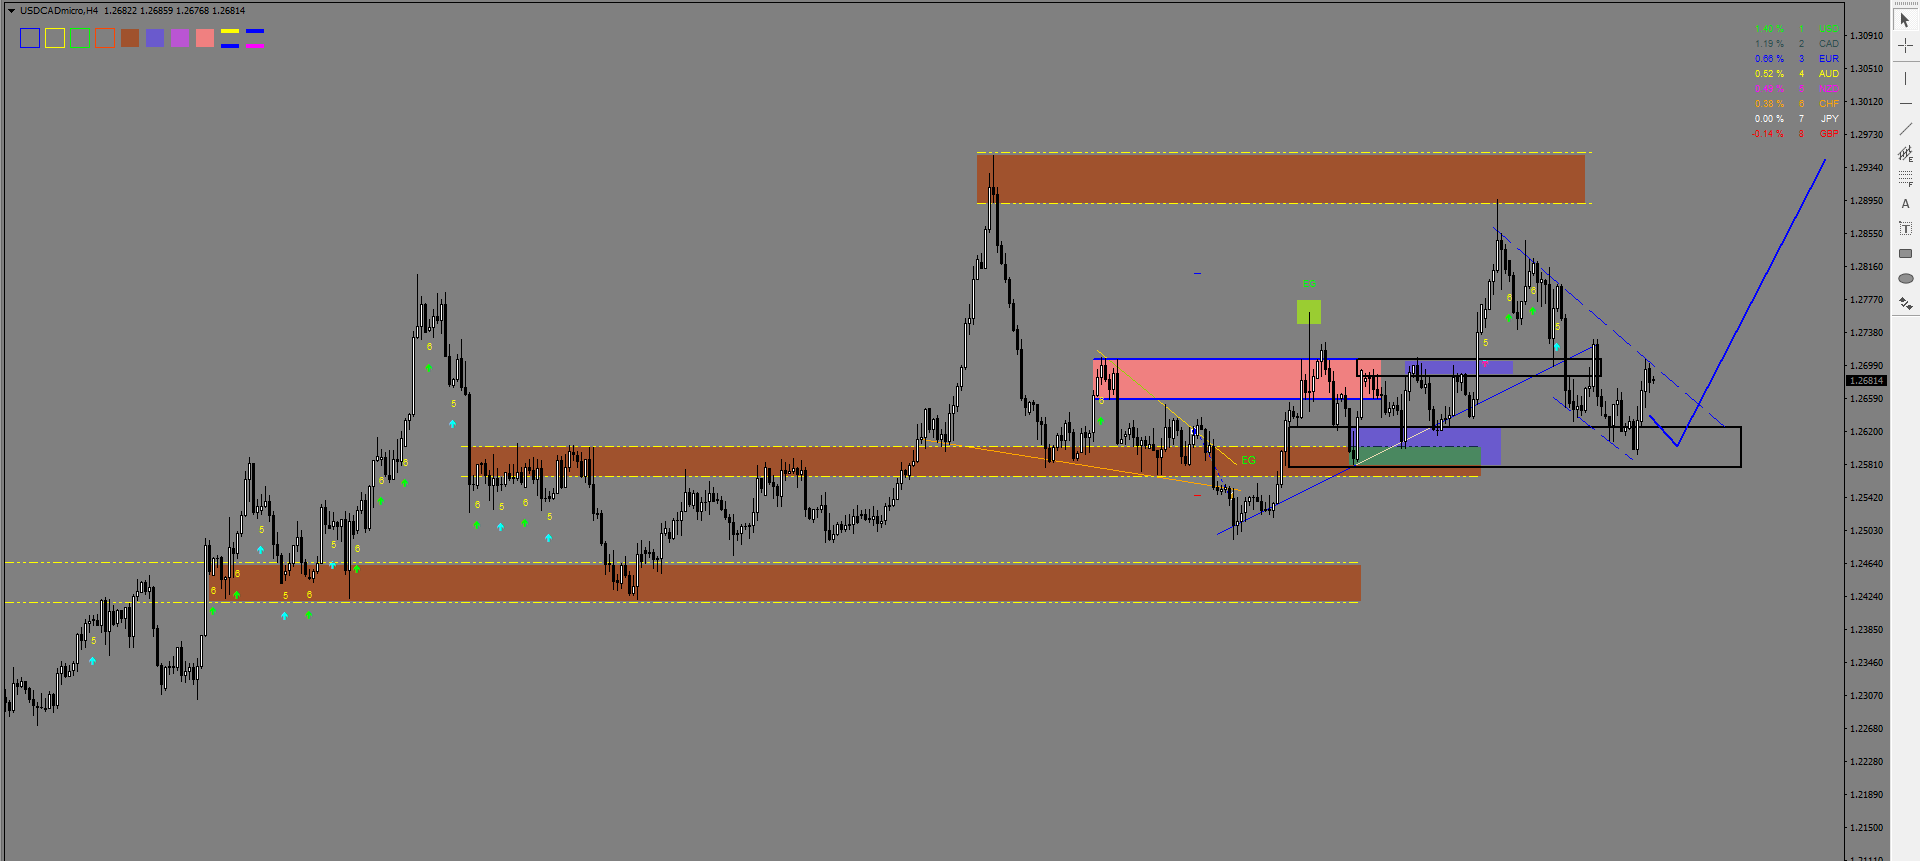
At this moment I really can’t say… If we can break above current flag (pink trend line). There will be tones of stop losses accumulating above this trend line so it will make sense to hunt those first and then reach 1.64.
 How I see it is, moving a big position through different crosses makes the most sense in order to fill the orders at best prices, which give rises to the correlation. This can present more opportunities to the trader;