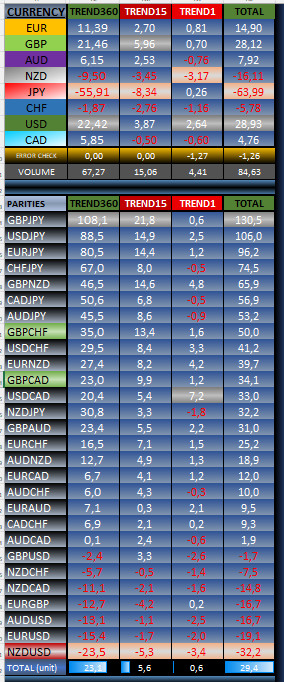
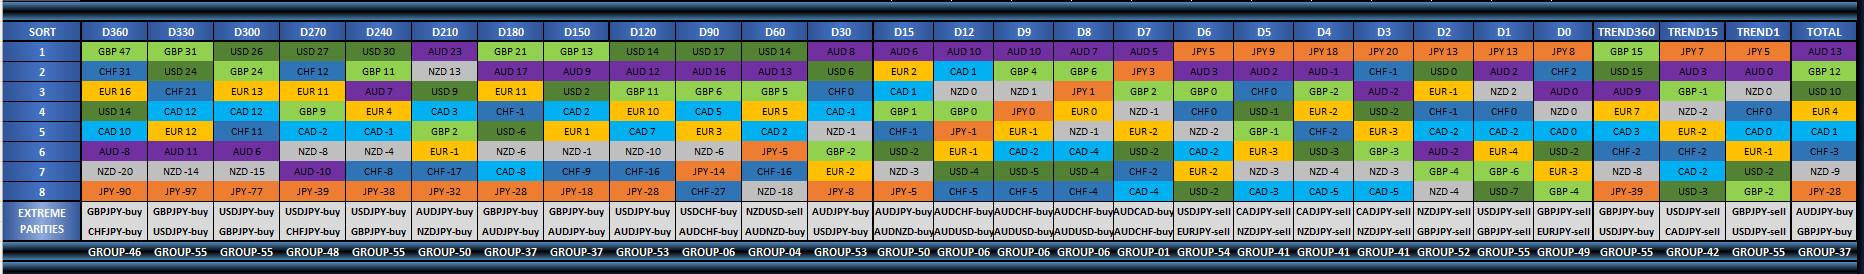
“The power table for the last 24 hours.”

“And a brief summary update.”

I am gone for a week and this is what I come home too. LOL ![]()
We did get a nice rally in stocks to close the week so my retirement is up a bit,
It is nice to be able to take a week-long cruise and have more money than when you left, I guess I need to go on more cruises
Let’s have a great new week

Things are getting back to normal with all yen pairs up, US stocks had a nice up day as well

Yen pairs inch higher, personally, I do not like this action, after last week’s big moves down, this rally seems more like a dead cat bounce. Time will tell

Another up day for all yen pairs

We continue to creep higher,

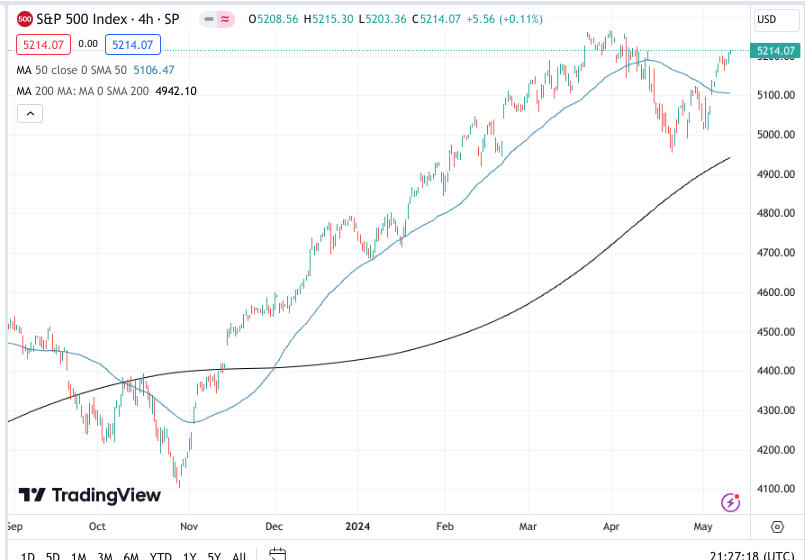
US stocks nearing new highs. Is not the common wisdom to " sell in May and go away"
Yen pairs regain most of last week’s losses, what happens next week is a coin toss

We continue to creep higher

A slow rise after a steep fast decline is not what I like to see. If you are riding this move higher be aware it could end very quickly

Correct! You are right on the money!
I use the Internal Bar Strength (IBS) calculation/indicator as a relative strength filter/confirmation. The IBS is a leading indicator. I use some price action confluence and economic data releases for timing of my entries and exits.
If IBS is < 20 it’s a Buy. If IBS is > 80 it’s a Sell. It confirms JPY’s coming strength so I am looking to shorting the AUDJPY, EURJPY and USDJPY .
USDJPY is already at a key level ready to be short as per Dennis’ chart i.e. price is at support-turned resistance level. The IBS reading is at 93 for todays daily bar. The stochastic oscillator is overbought-- excellent level to short this pair after the PMI economic news and Jerome Powell’s speech tomorrow.
Whereas, AUDJPY and EURJPY both busy forming their last leg anchor of double top reversal M patterns. Both pairs are currently overbought. IBS readings are at 88 and 87 respectively confirming reversals. One just needs to be patient with these two
First that I have heard of this indicator, MT4 I assume?
Where can it be found?
Do you care to share some charts to demonstrate the JPY setups?
Thanks.
Here is a link an MT5 link
Free download of the 'IBS' indicator by 'GODZILLA' for MetaTrader 5 in the MQL5 Code Base, 2012.02.03.
I personally prefer the manual computation of the IBS on the specific daily signal bar to the indicator as the calculation is relatively simple.
I have dropped the time frame to H1. There is confluence of a key level with Fibs at 156.00-156.20 zone, EMA 13/48 are about to cross down. Williams %R and Stochastics also confirm the overbought condition.
Okay, thanks, but not a chart that I understand, I will stick to RSI when I need to use an oscillator.


The last time NZD was number one was back in February

Staying short the Yen was the play of the week.
Note, that I will be traveling for the next few days, my next post will be on Wednesday