Thank you [B]TalonD[/B] for helping stir this conversation along. What follows is a comparison of my system on Daily vs. 1H time frames. I have tested MA systems with similar results.
I have already optimized my parameters for the daily system, so I ought to do the same for the hourly system. We are looking for those “smaller trends” you are hoping to catch.
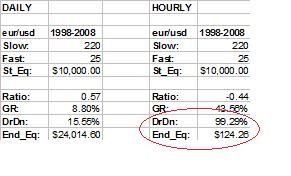
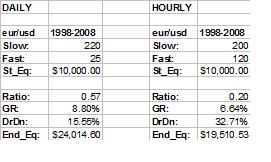
If we simply keep our numbers alike but reduce their length from days to hours, here’s a typical result:
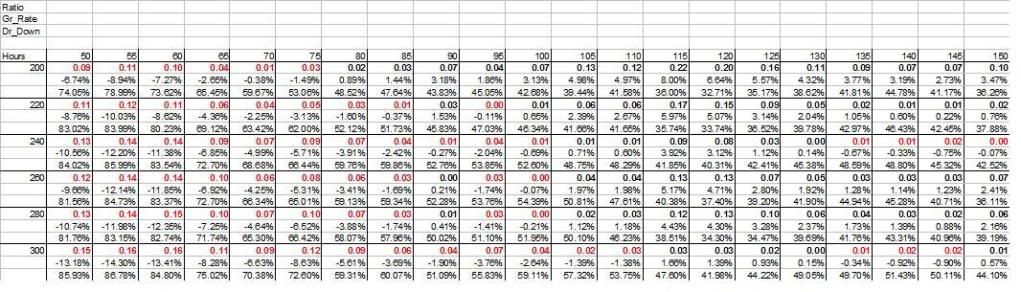
I have optimized the amount of hours in the lookback period from 1 to 1000. I will show an excerpt of this in a later post to give the reader a sense of what is going on: as the number of hours gets larger, so does profitability.
As you can see, this is an optimization chart obtained by running my system over and over with varying parameters. The parameters tested here are the amount of hours we use in our lookback period. Remember, I use a longer period for my directional filter, then a shorter period for entry/exit.
Vertically, we have the directional filter hours, and horizontally the entry/exit hours. The red numbers represent negative numbers (losing systems). The numbers below this ratio are the Growth Rates and Draw Downs.
As you can see, systems get more profitable with longer periods.
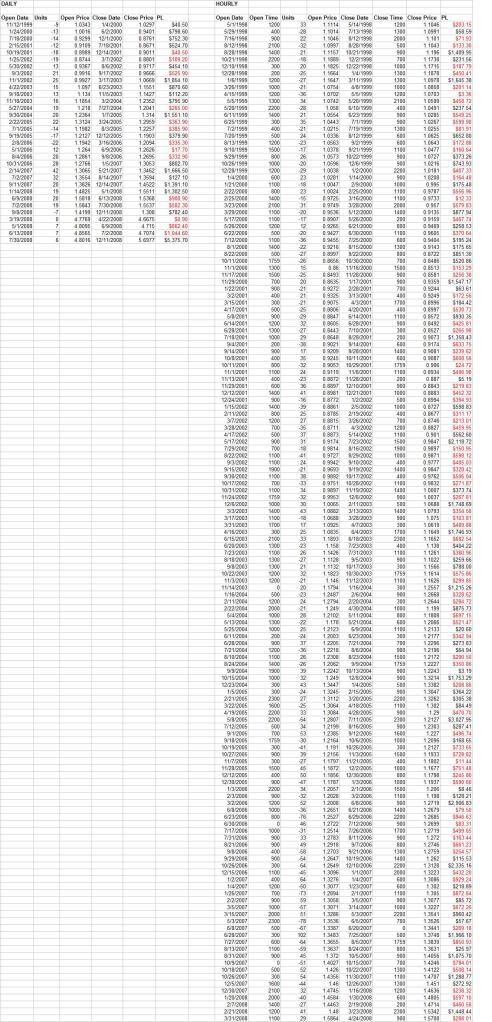
We can also compare the trade logs of both systems to develop more insights.
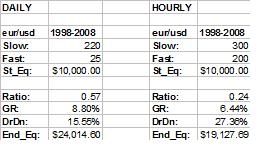
Here’s another Daily vs. Hourly example. As we’ve seen from the optimization chart, we need at least 120 hours in our lookback period for our hourly system to become profitable. For better profits, we need longer periods:
The hourly system is getting closer. Keep in mind, however, that 200 hours is a little more than 8 days. So our hourly system is becoming a daily system through optimization.
Here, you can see that this hourly system generates more trades but that more of those are losses. The only person who benefits from this type of trading is your broker:
Without question quite the most obscure way of making pips I’ve yet seen on BP. 11 out of 10.
Took the liberty of taking a screenshot of trades I just opened in the trend direction yesterday in demo for your delictation… some well into a trend and frankly not good prospects but I hope it proves a point.
Why complicate things? Just follow the bloody obvious!
So you turned 10,000 into 24,000 + in 14 years? According to backtesting, So in other words that’s $500 for every standard lot traded? (2 lots in your example)
The whole point of this was the show that higher times frames generated better results (for your strategy) & multiple pairs increase your diversity & decreased your drawdown by 50%+ (in your examples) ?
Been a while since I looked at this thread. I forgot those charts were showing 1998 to 2008, ten years. Was thinking it was one year. And I used to have such a good memory…
The whole point is that, with a little effort, you can build your own system with your own parameters without having to rely on anyone’s “advice” or “hot tips”.
Wouldn’t you agree though that, while what I describe can seem complex at first glance, it isn’t actually complicated. I mean complicated in the literal sense where someone is making something more complex than it needs to be to function.
I say this because my main goal in this thread was to actually break things down at their most basic levels (price data) and showing how abstract concepts like diversification work at that basic level.
The human mind has a drive towards abstraction. That is how it grows, by automating certain learned functions so that it can focus all of its energies on new problems or obstacles to conquer, then abstract those processes.
Yet if one starts with an abstraction, but fails to “go backwards” and examine the basis for the abstraction, well here’s a higher authority than any of ours on the subject:
A little Learning is a dangerous Thing;
Drink deep, or taste not the Pierian Spring:
There shallow Draughts intoxicate the Brain,
And drinking largely sobers us again. (Alexander Pope)
LOL… sorry for being so… errr… forthright in my opinion. Had eleventy beers that night! Its sure a well thought out and back tested system… just seems to my eyes to be one hell of a way to gather pips… no offense intended.
Why not just trade the trends on the higher TF’s? Closed out those demo trades at over 1500 pips. In real I trade the same way but with different indi’s on the daily but looking to the weekly and monthly TF.