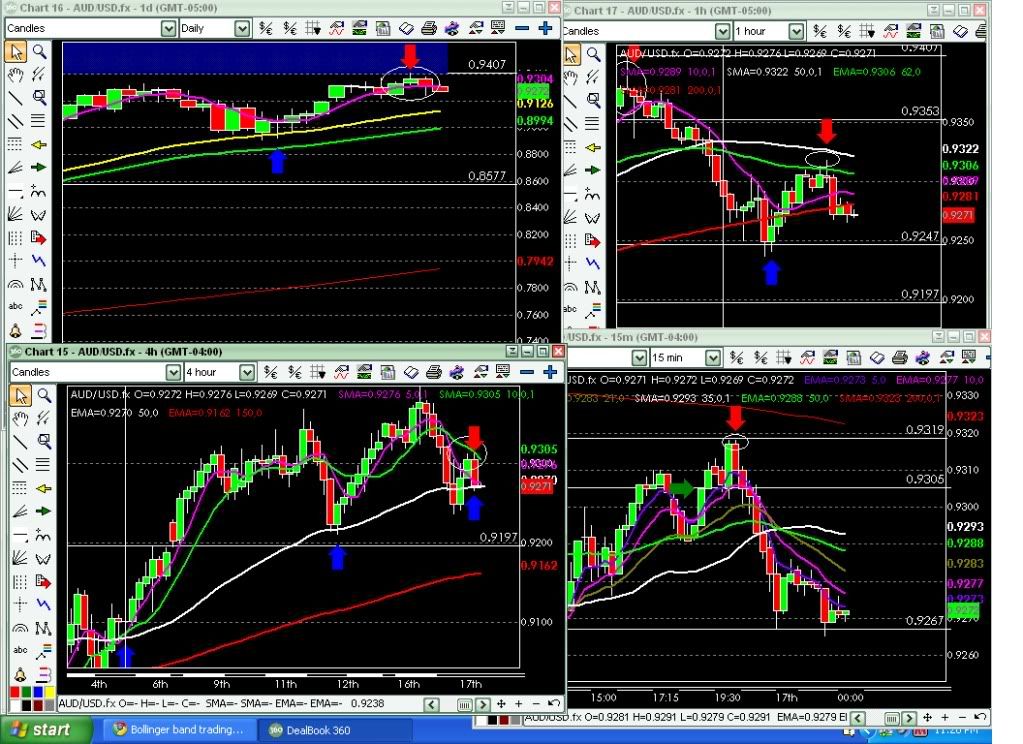
Yes The flash cards are a great tool , I actually made those almost a year ago. But without the information in the manual it is of limited use. Yes the PA ( Price Action ) and PPA (Previous Price Action ) are the easiest to see. Which is why we look for that first when reaching a area we have marked on our Charts for a possible reversal. Then we watch for a entry signal.
The entries alone are hard to see , it is a learning process. The same as learning anything you ever have. I find it hard to understand why people can not understand this. When we learned to drive. We all were anxious and scared and unsure of ourselves. Yet now we jump in turn the key and zoom off. Knowing whatever happens what to do. But you learned to do this. You weren’t born doing it.
That is the biggest failure I believe of most traders, they are to impatient to keep with one strategy or the other not giving themselves time to allow their mind to be able to process the information. If you can’t understand what I am saying you will disagree wholeheartedly. But if you come to grips with that idea and actually try to teach yourself how to learn whichever strategy you choose then you can succeed.
Remember as a child you used to have to do things repetitively to learn multiplication tables. hand writing over and over and this when we were young and our minds were more open. There is know difference now. So give yourself sometime to learn before judging any strategy.
This is also why we can see signals or entries a few moments after they happen. We are learning to see them, we know what they look like after they have printed but not during. This is why I made the flashcards to help teach my mind what I need to see. We have lots of entries to take after a candle prints (Closes). So they can be easier to take, But the touch trades or retest trades are available more often. But if you have been trading very long at all you should understand breakouts and retest trades as their are many strategies that use those entries.
Yes the dotted green line on my chart is a reference line to let me know that price is approaching the 62 ema on the 1 Hr. chart. and yes to transfer any MA’s to a lower chart just multiply the amount of candles. This ema is 248.
I use it because with almost all signals the higher the time frame chart it is on the more reliable it is. The 62 ema is a retracement trade it normally aligns itself with a major fib level and it can be a great entry for a decent size trade. The same as the 35/50 cross reversal trade but it is on the 15 Min. but also is a retracement trade. The use of any of the tools you are comfortable with until you start to see without their use is fine. But you will start to see that the MA’s we use align themselves with fib levels, pivots, S/R areas and almost any other tool you may have used. They are just a simple quick visual aid to see the entry areas quicker.
They also allow us to see possible trades during almost any trading time. As long as the price is moving we can catch a trade. If you look at the flashcard pdf. Those trades worth over 200 pips took place at the end of the session U.S. on a Friday afternoon. Not normally a great time to trade.
The use of this information for long term traders. Is to wait for price to near your already marked areas of possibilities. Then using the lower time frame charts . get a entry and cover your trade before you would normally even started to see the possibility of a entry. Then you can be a risk free trade the best place to ever be.
I know I said a lot more than you asked it wasn’t aimed at you just trying to impart some information here…
Trade Well Ken.


