Video Analysis of the Daily and 4 Hour Charts

Another trade here…this on the CHF JPY today.

This great provided a 2.66% Rate of Return in less than 24 Hours!

Check out the Video Analysis summary and the Charts below to see how I used the Candlestick Pattern of Double Bottoms, Uptrend Lines and Resistance & Support to capture this quick trading gain!

Once again, as long as you know how to analyze the Daily and 4 Hour with Candlesticks, Trendlines and Consolidation Patterns, consistent trading gains per week can be yours Short-Term and over the Long-Term.

Duane
DRFXSWINGTRADING

Started off the New Year on the right foot with this 1st trade that provided a 1.41% Return on the USD JPY. As you’ll see in this highlight video, I traded the Range Consolidation Breakout on the 4 Hour that was leading to the formation of a larger Range Setup on the Daily Chart. https://youtu.be/NC3BKoS2Vco

Traded the Bearish Movement that was leading to the formation of a Range on the Daily.

Duane
DRFXSWINGTRADING

This trade on the AUD NZD provided a quick 2.99% Return as I traded the Bearish Pennant Consolidation Breakout on its 4 Hour Chart down to the Support of the larger Pennant on the Daily Chart. Check out the Video Summary and Charts below.

Another example of the fast moving setups I target.

Duane

DRFXTRADING

This Chart can help in deciding how to trade. Trading in the direction of the main trend direction of the Daily Chart increases your chances of success. Trading against the trend can also be done, but those movements tend to be associated with weaker, less reliable signals.

These signals in the direction of the trend are a lot stronger because they are supported by the greater liquidity /market momentum of the main trend.

As you see from the last trade this week on the AUD NZD, the main trend was Bearish on the Daily Chart.

The market had also formed a Pennant and was at Resistance, with the prediction that it was heading to Support, in the direction of the main Downtrend…

And as you can see, the 4 Hour had formed a smaller Pennant at that Resistance, with a strong Setup and Bearish Signal.

So given the strength of the signal that was supported by the momentum of the downtrend, a short position was opened…

…with the pair hitting Support as predicted…

So this strategy will reduce the temptation to trade against the trend and focus only on setups that have a higher probability of success.

There are some exceptions where trading against the trend is justified, but there is greater peace of mind when you know that you are trading in the same direction of the major players in the market.

Duane
DRFXSWINGTRADING

Since the new strategy was implemented on December 1st, 2019, the Rate of Return is now at 12.87% for the 6 week period up to January 10th, 2020. This is a little behind the 14% Monthly Target, but only a few trades will be needed to put us back on track, before heading to the next target of 30% by the end of January!

The significant aspect of this performance is that it has come from just a few trades and only one small losss. This is confirmation that we do not to trade several times to achieve large Rate of Return Targets in the Short-Term and over the Long-Term.

As you will see from the Videos of these trades below, the key elements of this trading accuracy are:

1. Trading the Accurate Candlestick, Consolidation and Trend Line Patterns of the Daily and 4 Hour Charts.

2. Trading Setups (Double Tops and Bottoms, Consolidation Breakouts, False Breakout Reversals) that are likely to move the market quickly to Support and Resistance Targets within 24 Hours.

3. Never using Statistical Indicators or Economic Analysis.

4. Having the discipline to never monitor our trades.

5. Obeying the trading rules and guidelines to ensure trading success every week!!

VIDEO HIGHLIGHT OF THE AUD NZD TRADE

VIDEO HIGHLIGHT OF THE USD JPY TRADE

VIDEO HIGHLIGHT OF THE AUD CAD TRADE

VIDEO HIGHLIGHT OF THE CHF JPY TRADE

VIDEO HIGHLIGHT AND ANALYSIS OF THE CHF JPY TRADE

It is very important to also resist the temptation to trade the smaller charts. These may have some advantages, but given their volatilty and high number of False Signals that lead to unexpected losses, profitability from them will be hard to achieve.

Instead, if we stick to trading only on the Daily and 4 Hour Charts that provide:

1. Reliable Signals with Fewer False Signals

2. Small and Strong Stop Losses

3. Average Rates of Returns of 3.0% in just 24 Hours!!

…Trading Success from this Trillion Dollar Market is almost Guaranteed!!

Duane
DRFXTRADING

Nice strategy by the way, the signals are supported by liquidity.

1 Like

what signal provider do you use (if any)?

These signals are from my own strategy that I created. Entry, Stop Loss and Targets are based on targeting a minimum of 3% on average, once the setup meets the criteria of my strategy,

Hey traders,

This recent trade on the GBP JPY provided a strong 4.96% Rate of Return today, as I traded the Consolidation Breakout that was taking place on the 4 Hour Chart. This has pushed the overall Rate of Return up to 18.47%, since the new and more refined trading strategy began on December1st last year.

Amazingly, this has come from just 9 trades with just one small trading loss…

…which has now pushed the return above the half way point to the next target of 30%.

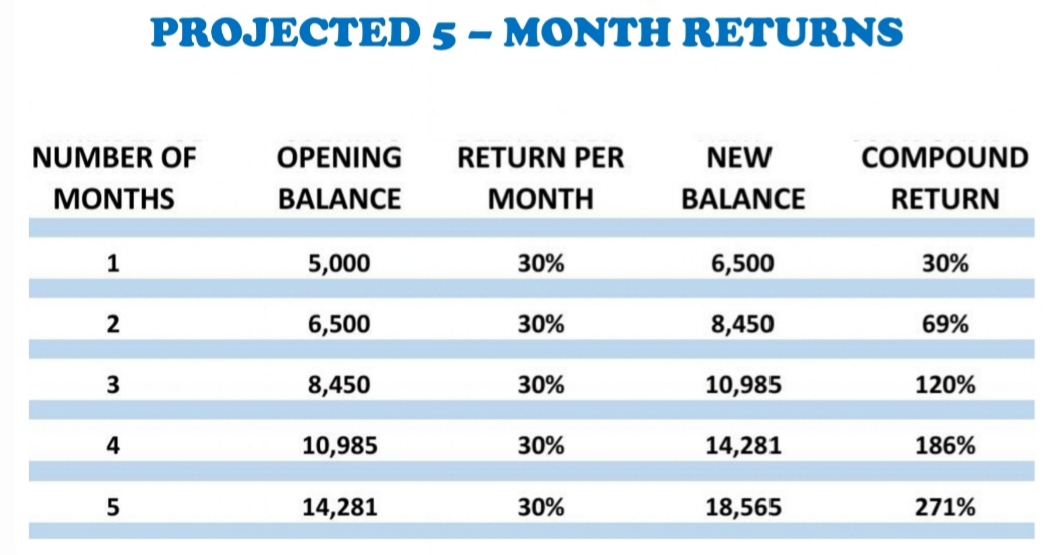
This table represents the 6 main targets to be hit over a 6-Month Period. It assumes a Monthly Return of 14% (compounded) and based on this impressive performance so far, the 30% target should be hit by the end of January with just a few more trades.
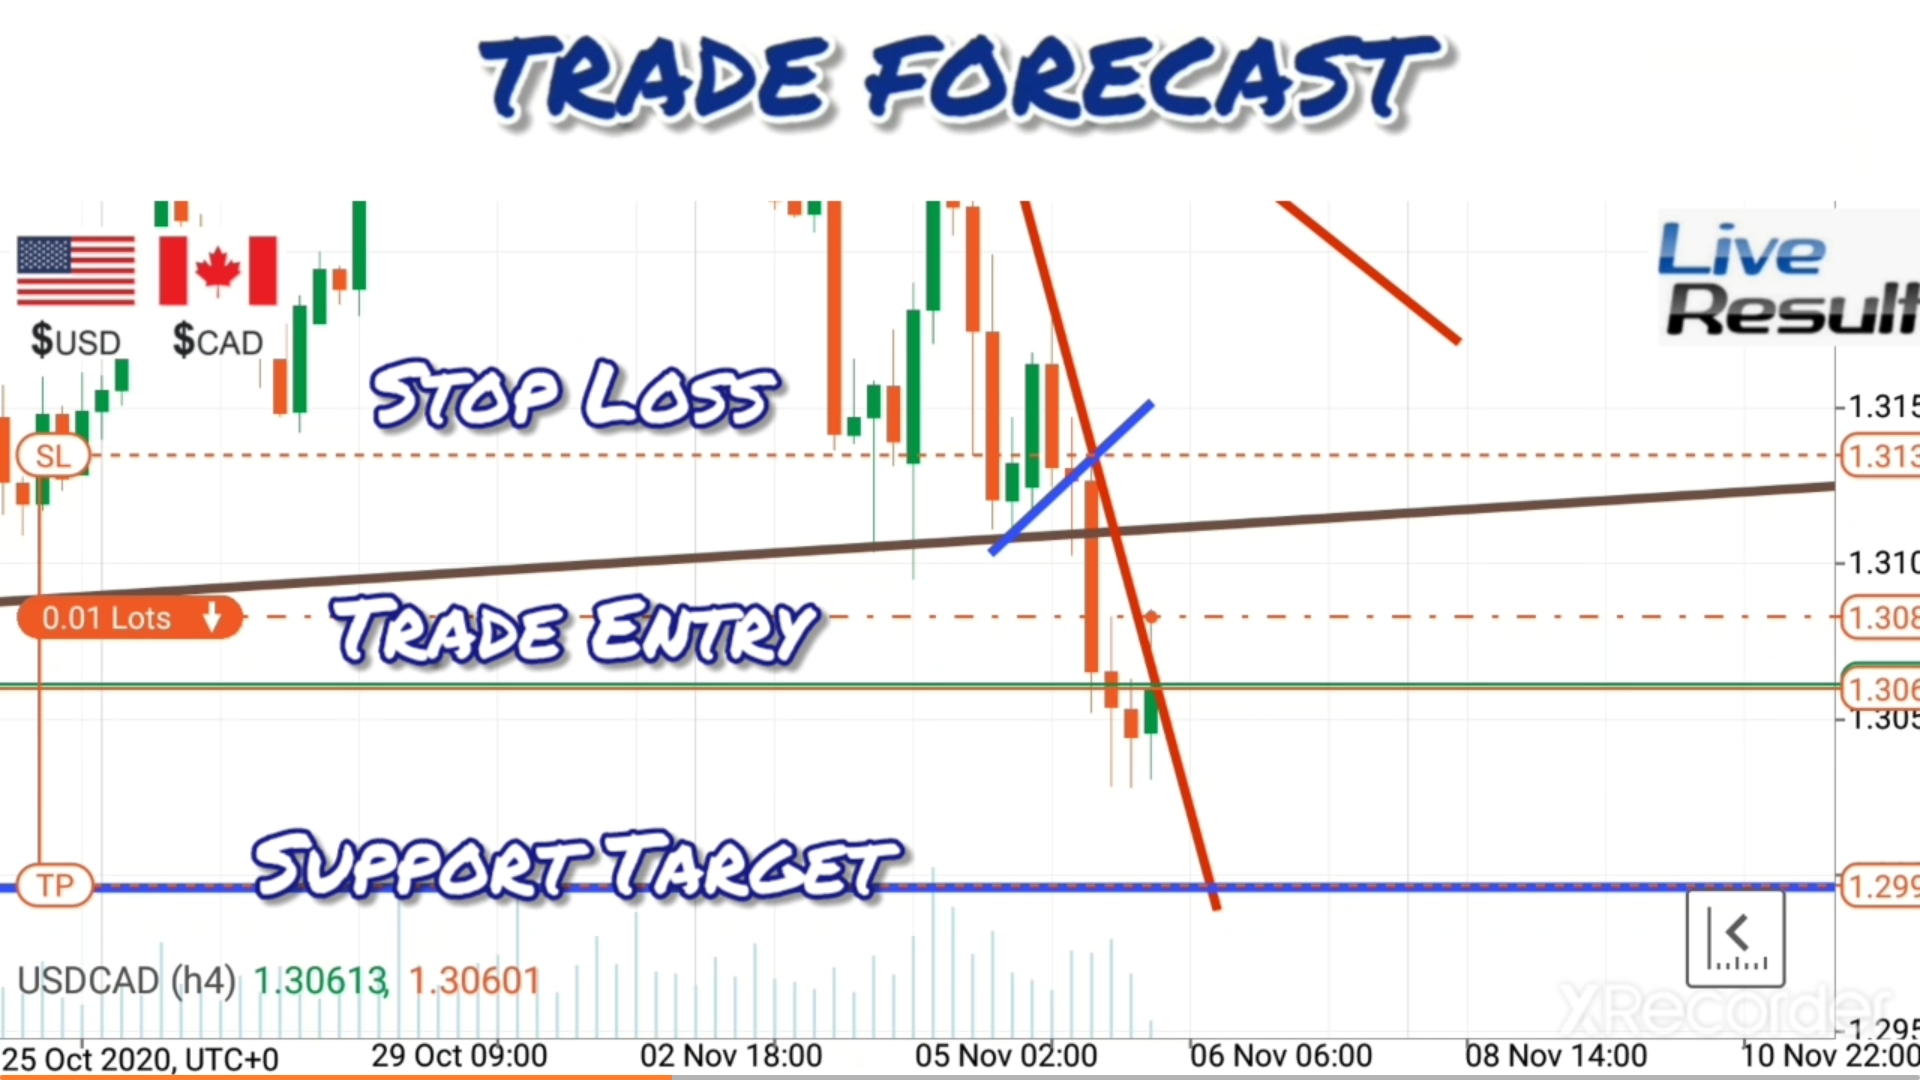
TRADE SETUP

This trade involved trading the Bullish Breakout from the Range Consolidation Setup that had been formed on the 4 Hour Chart. This was also part of the larger Range Consolidation Setup that was gradually being formed on the Daily Chart…

As you can see, the pair was expected to rally to the Resistance at 144.35 at which point it would then reverse Bearish to complete the Range Setup. So the trade was expected to take advantage of the brief rally ahead of the reversal back to the major Support on the Daily Chart.

STOP LOSS AREA

To protect the trade, the Stop Loss was placed just below the Uptrend Line that was formed as part of the breakout…

This was in keeping with my strategy of using the 4 Hour Chart for Stop Loss Placement. In some cases where necessary, strong areas on the 1 Hour Chart are also used if the Stop Loss area on the 4 Hour would be too far away from entry.
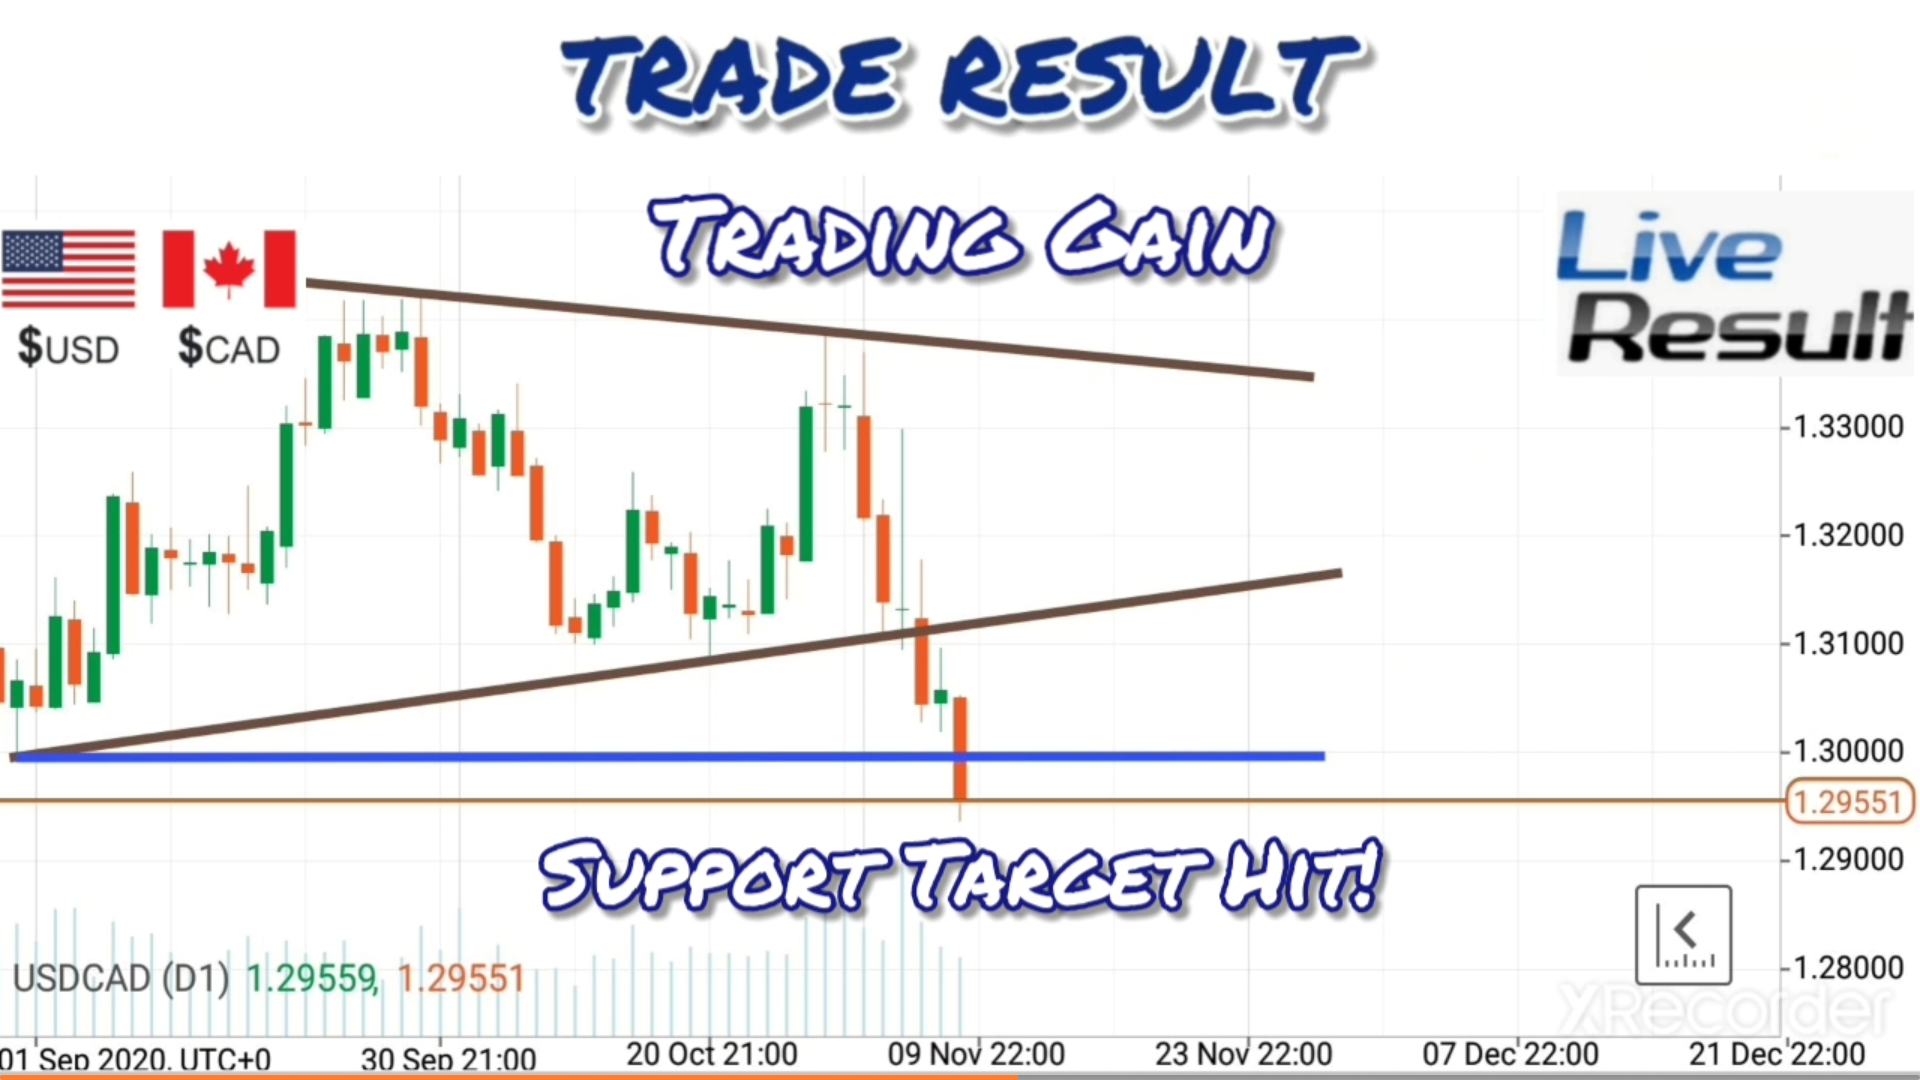
TRADE RESULT

After entering the trade, I then followed the following guidelines that I highly recommend to traders in order to ensure success and avoid self-sabotaging your results…

  1. Use a 24 Hour Maximum Holding Period for these short term trades.

  2. Close the Platform and only check back periodically. Configure your trading platform so that you can only see that the trade is still open, WITHOUT being able to see the Charts or Floating Profit. This will help avoid the temptation to interfere with the trade.

  3. Do not follow news related to the market or your traded currency pair.

  4. Always close trades within 24 Hours if the target has not been hit.

These are important rules that I emphasize must be followed so that we do not interfere unnecessarily with the trades.

After patiently waiting for the trade to be completed, I received the email alert from my platform indicating that the trade was successfully completed in just over 14 Hours. The Resistance target was hit as predicted to provide the 45 Pips Gain and a strong 4.96% Rate of Return.

REVERSAL AND TRADING LOSS AVOIDED

Now, a very important aspect of this trade and my strategy in general, is the ability to successfully exit trades ahead of market reversals - a major hurdle faced by many Retail Traders.

As you can see from the Chart below on the 4 Hour, the trade was closed just ahead of the reversal that took place as expected. As you can see, the market pulled back to where the Stop Loss was placed at 143.57 which would have led to a trading loss had I made the mistake of aiming for a target beyond that Resistance !!

This proves once again that staying on the Larger Charts allows us to better see these major pullback points that start major trend reversals, which can easily be overlooked when trading on the smaller charts.

It also shows that Consolidation Breakout Signals on the Larger Charts - once strong enough - are more reliable compared to those on the lower charts - with fewer cases of False Breakout Reversals.

Check out the video below of this trade and let me know if you have any questions regarding the setup or my strategy.

As I keep saying over and over. You do not need to use Statistical Indicators, Economic Analysis or the Smaller Charts to profitably trade the Forex. Once you have a good strategy based on Powerful Candlestick Patterns formed on the stable Larger Charts and do so with a strict set of rules and guidelines everytime you trade, consistent trading success will be yours over the Long-Term!

Duane
DRFXTRADING

Hey traders, how goes it with the market?

Last week was quite exciting with the market patterns of the Forex heavily influenced by the Interest Rate decisions and Monetary Policy Committee Minutes of the major Central Banks as well as important Inflation (NZD) and Employment Data (AUD). Similar announcements are also scheduled for this week which means more opportunities to capture strong trading gains are likely for us in the days ahead!

The latest trade from my new Trading Strategy came on the NZD CAD earlier today, Monday January 28. The trade provided a quick and aggressive 17- Pip Gain and a 2.96% Rate of Return, as I traded the False Consolidation Breakout Reversal on its Daily and 4 Hour Charts. This has now pushed the Rate of Return of the new strategy up to 21.94% since it began on December 1st, 2020.

Amazingly this has come from just 10 trades and only 1 small loss!

What this trading accuracy means is that only 3 successful trades are now needed to hit the next target of a 30% Rate of Return!

Hitting this next target will demonstrate that fast and large Rates of Returns are possible on the Forex with a tremendous level of accuracy once we correctly use the reliable Candlestick Patterns, Trend Lines and Consolidation Patterns on the Daily and 4 Hour Charts!

THE TRADE SETUP

As you can see from the Daily and 4 Hour Charts below, both had recently formed Pennant Consolidation Setups with a recent attempted breakout above Resistance. However, because of the weakness of the Bull Candles, instead of continuing to provide sharp Bullish Gains in favour of the New Zealand Dollar, the market reversed sharply to take us back inside of the setup…

In keeping with the theory of False Consolidation Breakout Reversals, this meant that the Support Target was likely to be hit to complete the move, ahead of a possible breakout Bearish below that boundary…

Given the likelihood of this continued decline, I decided to trade the pair short…

After pulling back to trigger my Entry Order…

…the market continued towards Support to provide me with the trading gain…

Check out the Video Highlight of this trade and let me know if you have any questions.

MAIN TECHNICAL FACTORS OF TRADE:

  1. Weak Breakout Candles often indicate the likelihood of a False Breakout Reversal.

  2. False Breakout Reversals will usually take the pair back towards the other boundary.

  3. Even though the reversal usually leads to a breakout at the other boundary, it is always better to exit at this boundary to secure a trading gain. This is because there are times when a breakout may not take place or will do so after a very long pause.

  4. Downtrend and Uptrend Lines can be used for safe Stop Loss Placements.

  5. Accurately identifying Support and Resistance lines is key to spotting profitable trading opportunities!

Regards

Duane
DRFXTRADING

Hey traders

Another quick summary of a successful trade using my strategy, as I target High Probability Trades that can provide fast gains in less than 24 Hours!

This took place on the AUD USD this week as I took advantage of the Consolidation Setups on the Daily and 4 Hour Charts, to capture a fast and large Rate of Return of 3.13% in just 4 Hours!

As you can see in the chart below, the Daily was completing the formation of its Pennant with a Bearish move down to the Support at 0.66724.

Supporting this forecast was the Bearish Breakout from the Pennant Setup on the 4 Hour Chart…

These Pennants represent one of the 4 main types of Consolidation Setups that we see formed on the Daily and 4 Hour Charts every week…

The Breakout Signal provided on the 4 Hour was also one of the 3 ways in which Consolidation Breakouts take place…

  1. A Single Candle Breakout
  2. A Temporary Pullback at Resistance/Support before the Breakout
  3. A Breakout followed by a test of Resistance/Support, before resuming the Breakout.

After analyzing the setups and signals on both Charts, I decided that it was a High Probability Trade that was likely to provide me with a profitable outcome.

Now although entry at the closing price of the Bear Candle was possible, it would not have allowed me to capture my minimum Rate of Return of 3.0%. This meant that I had to use an Entry Order to get in at a higher price to meet this rule…

To protect the trade against possible temporary reversals that could have taken place, the Stop Loss was placed at the Downtrend Line on the 1 Hour Chart. Although I usually use the 4 Hour Chart for my Stop Losses when trading, I will sometimes use the 1 Hour if the 4H does not provide one that is close enough to my entry. In this case, the closest Stop Loss area on the 4 Hour Chart would have been all the way up at the Resistance of the Pennant - much too far away!

Trendlines are great areas to protect our trades because they act as barriers that limit temporary reversals until the trend finally ends.

After pulling back to trigger my order and take me into the trade, the market immediately resumed the aggressive Bearish Breakout to hit my trading target at Support…

You can also see that the trading gain was captured right before the Sharp Bullish Reversal that took place . This highlighted the accuracy of my trade target decision…

So another great trade that showed once again that Candlestick Patterns , Trendlines and Consolidation Setups are all we need to profitably trade this Trillion Dollar Forex Market - as long as they are used correctly with the right Trading Strategy!

Regards

Duane
DRFXSWINGTRADING

ACCURATELY EXITING YOUR TRADES AHEAD OF SHARP REVERSALS

Recent trade on the AUD USD shows how I accurately exited the trade for the 3.13% Return described above ahead of the Sharp Reversal at Support!

When I actually checked my charts, I noticed that the market reversed within 1 Pip of the 0.66724 Support. However, since the Pip Spread was 2 and I set my exit 3 Pips of that price, I was able to capture the gain in just 4 Hours. Even though the market eventually reversed Bearish once again to break through the Support, I would have had to wait 36 Hours instead of just 4 Hours for the same trading gain!

This is why we should always exit trades within 3 to 5 Pips of Support Prices to cover the Pip Spread and in case the market reverses without hitting Support!

YouTube Video Highlight of the trade: https://youtu.be/H3LsyWAeDNk

Duane
DRFXSWINGTRADING

1 Like

HOW DO YOU STOP LOSING IN TRADING?

Simple. Stop trading the Smaller Charts.

Larger Charts offer the same quick trades with more Reliable Setups, but without the Volatility, Stress and Fear that lead to losses!

20200222_100357

Duane
DRFXSWINGTRADING

Hey traders,

Latest trade from my strategy came from the USD CHF that provided a 2.00% Rate of Return in just 4 Hours, as I traded the Sharp False Breakout Reversal on the Daily and 4 Hour Charts. A strong Bear Crown Setup above the Range indicated the start of the reversal, which was exited succesfully for 34 Pips, just head of the Sharp Bullish Reversal and Trendline Break at Support.

This has pushed the Rate of Return of the new strategy up to 23.78% in just 3 Months, coming from only 14 trades and just a few small losses along the way!

SHARP FALSE BREAKOUT REVERSAL

Daily Chart shows the False Breakout Reversal that started with a Bear Crown Setup at Resistance. Based on the theory of False Breakout Reversals, the pair was likely to take us down back to Support on its way to a Break below this boundary…

Given this likelihood of a move to Support, entry then took place on the 4 Hour Chart, with the Inner Downtrend Line being used for the Stop Loss. This is in sync with my trading strategy…

After just a few hours, the pair continued to Support as expected to provide me with the trading gain…

…and as you can see, this gain was captured just ahead of the Sharp Reversal and Trend Line Break that took place at Support…

Again, this showed the importance of accurately identifying market setups and trading targets. This allows us to Maximize on our trading gains ahead of Sharp Reversals that can quickly take away our profits!!

Stay on the Larger Charts, use accurate Japanese Candlestick Patterns, Trendlines and Consolidation Patterns, and long term success can be ours in this dangerous Trillion Dollar Market!!

Duane
DRFXSWINGTRADING

THE REALITY OF THE FOREX & WHY PEOPLE FAIL

I recently watched a few videos on the Forex on YouTube this weekend that made me realize once again that there continues to be a significant amount of misinformation and irresponsible advice being promoted that is leading traders in the wrong direction.

Many people still think that Forex cannot be traded profitably and that it is similar to betting because there is no pattern to the market. People also still think Demo trading should be ignored and you should go Live as quickly as possible because it doesnt reflect real conditions and you won’t take it seriously…bla bla bla.

Even though I could spend all day speaking to these and other issues, I’ll just provide a few points that summarize my opinion about Forex Trading and why most people fail

  1. Forex is difficult because there are no globally certified Universities/recognized institutions that teach it compared to other disciplines like Economics or Medicine. You cant earn a degree in Forex Trading after a 3 or 4 Year programme with a globally accredited curriculum that guarantees your success. This is why people are left on their own to try to predict a difficult market, using less than perfect trading tools.

  2. Despite this major challenge, the Forex can be analyzed, predicted and traded with a large degree of certainty, because like other markets, Forex has a pattern and cycle of behaviour that is repeated every week. Any market that has these features can be traded and accurately predicted. If this were not the case then Central Banks and financial institutions would not be able to do what they do successfully.

  3. The other problem for Forex traders is that we are trying to predict market direction on a very short term basis using tools that are not sufficiently tested, are not as sophisticated, recognized or even used by Central Banks and Investment firms. This is why most fail to find a method that works longterm.

  4. Its even harder to do so if we try to trade the smaller time frames which are a lot more volatile than the larger time frames, or try to trade everyday. Trading every day exposes your capital and your emotions to ups and downs that most people cant handle. The highs from winning or the fear you feel after experiencing a loss one day can easily cloud your judgement the next day, leading you to make careless mistakes.

  5. Even though the tools of Trendlines, Candlesticks, and Indicators are not used by Central Banks etc, they can still be accurate enough to be profitable. The challenge is to extensively test them for several years under all market conditions in order to find the right combinations that work, similar to the Regression Analysis that Banks do and the trial and error process needed to establish reliable relationships between variables. The problem is that most people have never had the time nor the willingness to do this and end up using/buying systems that only work for a very short time.

  6. The successful Forex Traders are the ones who have found the right combination of these factors. They have taken the time to extensively test them for several years and have been rewarded with profitablilty by either trading daily or a few times per week or month.

  7. As you’ll see in this thread, however, my preference is to trade the larger charts just a few times per week. You will have less trade-related stress and have more time to recover from the emotions of wins and losses. It also allows you to have a normal life away from your trading screen, making it a more practical option for most people with a 9 to 5 job over the Long Run.

  8. Start and practice on a Demo Account for at least 6 Months. Most fail becaise they jump too early into Live Trading. The reason brokers provide Demo Accounts is that they are aware of the tremendous difficulty and failure rate of this market. Airline pilots practice with flight simulators, you take practice exams before a major exam and you learn to drive with a more experienced driver at slow speed and in a controlled environment and take your driving tests before being allowed to drive on your own! Its the same reason Demo Trading must also be TAKEN SERIOUSLY other wise you’ll be inadequately prepared for real market conditions.

So I hope this clarifies many of the doubts you have about Forex Trading as well as how and why you must take it seriously in order to guarantee your Trading Success. Find a methodology that works that you are comfortable with, practice it on a Demo to achieve the Rate of Return you want to achieve on a Live, then trade with a Live Account. This practice period will give you the confidence and experience needed for Long Term Profitability.

Duane
DRFXSWINGTRADING

any recent updates please? I really find this analysis useful, just need some up to date if possible please!!

@ZacKing

Hey man, hope youre good in these crazy times.

Back after a long break, after testing a new strategy to capture 6% to 8% Per Trade. This will complement the current one that targets 3% to 5%.

Both will also be based on the Signals and Patterns of the Daily and 4 Hour Charts, with the focus being on trading…

  1. False Breakout Reversals

  2. Movements between Resistance and Support within Consolidations.

  3. Consolidation Breakouts targeting a Major Support or Resistance Price Point that is nearby.

An example of this 3rd Strategy and my larger trading targets was this EUR CAD trade done this week.

It provided 106 Pips and a Rate of Return of 6.5% between Thursday of last week and Tuesday this week.

Check out the preview of the Full Video Analysis below.

Ignoring the Smaller Time Frames and focusing on the Stable and Reliable Setups offered by the Larger Charts will almost guarantee Long-Term Profitability

Regards

Duane
DRFXTRADING

Hey Traders

Another trade here to report.

Got 86 Pips from the USD CAD to provide me with a 4.93% Rate of Return.

The trade took advantage of the Consolidation Breakout on the Daily Chart…

…and the Downtrend that this created on the 4 Hour …

So as usual, the Daily Chart provided the Market Setup and Trend Direction, while the 4 Hour provided the Entry Setup.

The relevant sections of my Trading Manual that focus on Consolidation Breakouts were used.

Checkout the preview of the full Video Lesson for this trade.

Aiming for these types of Returns Per Trade will allow you to achieve large Monthly Returns over the Long-Run.

Duane

DRFXTRADING

Hey traders

Why did the USD CAD Reverse Sharply?

As you can see, later on in the week, the USD CAD reversed Bullish despite the fact that it was breaking out of a large Consolidation.

Normally breakouts from such large consolidations go on for days for several hundred Pips as illustrated here…

So why did this Reverse Sharply?

Because it had hit a Major Weekly and Daily Support at 1.2993…as illustrated with the Blue Line.

Regardless of the Size of the Consolidation, if a Major Support is close by, the market is VERY LIKELY to respond to it to either…

  1. Start a False Breakout Reversal

  2. Temporarily Pullback to test the brokenSupport Boundary before resuming the Breakout.

So either way, a rally and reversal is always likely at these Major Support Points and you should always exit trades at these areas.

Duane
DRFXTRADING

This is one of the bad habits guaranteed to lead to Self-Sabotaging Behaviour.

Because of the difficulty of trading the Forex and the pain associated with losing, especially if you are a beginner, it will always be tempting to monitor your trades to " Make Sure " that they have hit their targets. You will want to look for signs to confirm your decision about market direction and to possibly adjust your Stop Loss, or exit trades when you think you see the early signs of a reversal.

Now although this sounds like the rational thing to do to protect your money, it can actually be the WORST thing to do to ensure Long-Term Profitability.

FIGHTING THE MARKET

As with all markets, the natural dynamic of the Forex is that it will create waves, temporary reversals and even sideways movements before eventually hitting its targets. This means that a 100 Pip Bullish Trade can have a 20 or 30 Pip temporary reversal before resuming the move to a Resistance Target.

However, by watching the prices move up and down in front of you as part of this natural process, you will be tempted to exit trades too early or at least make unnecessary changes to your trades, out of FEAR that you will lose on the trade.

This means you can end up closing trades for smaller than planned Pips if you see these temporary pullbacks. This can be done by either closing trades at the current market price or being Stopped Out if you adjusted your Stop Loss along the way.

If this continues to be done over several trades, you will end up limiting your profitability as margins will not be as wide as they could be to cover losses.

SOLUTION?

SET PRICE ALERTS

Chosing a Trading Platform that allows you to set alerts will prevent you from being tempted to monitor trades.

If you want to check your trades before your targets are hit, configure the platform so that you cannot see the P/L, prices or Chart of the trade you are in but can see that the trade is still open. Many platforms have a Open Position tab that show how many positions are still opened with the number within brackets (1).

AVOID FX NEWS

Avoid watching FX News if your strategy is technical based - indicators, candlesticks etc. Watching news can tempt you to close trades or second guess yourself, if a news item reports a movement or projected movement in the pair that is against your trade direction.

However, these movements can simply reflect the temporary reversals that naturally take place, before the pair resumes the main trend direction.

These are the main Market Scenarios where temporary pullbacks are expected.

1 Testing of Broken Resistance/Support of Consolidation

  1. Testing of Broken Trend Lines.

  2. Testing of Broken Counter Trend Lines.

  3. Testing of Candlestick Formations.

Once you become familiar with these situations, you will become more relaxed about the movement of the market. You will be able to leave trades without yielding to the temptation to interfere, knowing that once you have a Profitable Strategy…

…most of your trades will be successful!

Duane
DRFXTRADING