Recent trade om Kiwi Dollar shows how Candlesticks are all we need.
Duane
Recent trade om Kiwi Dollar shows how Candlesticks are all we need.
Duane
i find your videos great. i believe that “simplicity is best” and I also agree with you that the “news” are already “priced in” and they usually show in the “candlestick charts/signals”. unless of course something completely out of left field happens that “none” knew of or expected then the analytics go out the window but this is extremely rare. i have noticed many news that came out (which I wasn’t aware of happening like the uk polls a few days back) that happened yet the market had already shown a candle signals (which I had traded) in such direction the move was of 200 pips (i was short gbp/jpy) boosted by the news but the signal was there about 18 or so hrs prior!
anyway, although I like your posts, what makes someone more readable is their results. why not post every week your actual pips results summary (like I have done in my own posts) starting with the last 100 trades, pips profits, win rate, etc in this way anyone can decide wether to follow you or not…
just food for thought
no money details are required just real live results…
I only trade 3 crosses (with some exceptions), I have a one page trading method that works for me, but I wouldn’t mind demo trading (this is what I usually do with new ideas) your forecasts but first I would love to know your track record
cheers
fxpirana
Thanks fxpirana
Yeah, Candlesticks keep things simple and they already tell what will happen before the news as you said. I´m a former Central Bank Economist and I can tell you that most of these news items are unreliable because of their short-term nature. Once you know which Candles are the most accurate/reliable, using these will be good enough.
Live Account record coming up in a few days.
I saw your thread…good trade results. What has been the overall performance with these 100 trades?
Regards
Duane
This describes the trade made at the end of last week as the pair continues to form the Consolidation Setup on the Daily and 4 Hour Charts.
[video]https://youtu.be/6GQbNcV-kpY[/video]
Once you know the Candlestick Patterns that predict these Setups, they can be traded for profit.
Duane
hi duane, yes I totally agree with you. Candlesticks keeps things so simple and furthermore, like you said, in one of your posts, for moves like 100-200 pips long term fundamentals are not required
Thanks for asking, my results were ok I just posted an update/summary and recap so to speak as the end of the challenge I placed to myself…this link should take you to the results summary. Overall +1,056 pips.
I am pleased with it, although I could’ve done better pips wise, but doubling my bank in 4 months is ok to me. Now I can move from 5% investment per trade down to 2.5% and continue betting at the same levels.
this is the link to the results.
TRADING OPPORTUNITY EXPECTED AS NZD JPY REVERSES IN THE DAYS AHEAD
Based on the Analysis of Consolidations, Candlestick Patterns and Resistance, we are gonna see a Major Reversal taking place over the next several months. This will start with a pullback at a Major Resistance Point at 83,80 and then a False Consolidation Reversal.
Daily Chart below shows the Major Resistance at 83,80 that has been hit…
DAILY CHARTS
… and the pullback taking place as a result of hitting this Resistance, despite starting a Breakout from Consolidation to resume the Uptrend…
WHY IS IT LIKELY TO PULLBACK DEEPER?
Even though the market can simply be pulling back temporarily before resuming the Bullish Trend – “Test of Pennant Resistance becoming Support”- the nature of the current Uptrend and the previous Downtrend tell us that a Large Consolidation is being formed…
There are certain types of waves that tell us that the market is forming a Consolidation. They usually are sharp and aggressive like these…
Since the waves of the NZD JPY are similar to these above, it is very likely we will see a Consolidation being formed…
This means that a False Breakout Consolidat. Reversal is likely in the next few days, presenting a trading opportunity along the way- see video- as it starts a Major Downtrend Reversal…
So given this projection for the next few days, if a Trading opportunity present itself…
1. What Type of Daily Candle Should we Expect?
2. What Type of 4H Candle Should be traded?
3. What Type of Stop Loss Should be used and how much?
4. How long should the trade be held?
All in the next video
Duane
I really appreciate your contribution! No doubt, video tutorial is one of the most useful way of learning for the beginners! Hope this helps them! Even, I like your chart analysis! Just be consistent here!
Hey Luke, thanks man, appreciate it.
NZD JPY REVERSES AS PREDICTED AND SHOWS WHY LOWER TIME FRAMES ARE DANGEROUS
So as you would have noticed, NZD JPY is now sharply bearish as I had forecast in the previous video. Unfortunately it didnt present any setups that I liked, but since this movement is expected to continue, a setup is still possible trading short .
There were 2 Main Technical Factors behind this accurate forecast and they are the main reasons why Smaller Time Frames are dangerous…
Once you close the Smaller Time Frames for good, you are MUCH MORE LIKELY to avoid unnecessary losses and trade in the major direction of the market.
MAIN ADVANTAGES OF LARGER TIME FRAMES?
Easier to See the Main Trend
Easier to Spot the Start of Reversals
Stable Signals
Reliable Setups
MAIN PROBLEMS OF SMALLER CHARTS
Easier to get surprised by major Reversals caused by the Larger Charts.
Volatile Movements
Unreliable Signals - More False Signals/Breakouts
Smaller Range of Movement/Profits
Weaker Stop Loss Areas
What say you!!???
Duane
You are always welcome! Keep it up.
THAT BULL CANDLE SIGNAL COULD BE A MARKET TRAP!
As strong as some Candles may be, they can easily lead to unexpected losses if they are traded in the wrong scenario…

When it comes to trading within Consolidations, this is a very common challenge.
While Consolidations are being formed, we can trade the Bullish and Bearish Waves that the market provides. However, we have to know the Appropriate Signals that can be traded for the TYPE and SIZE of the Consolidation being formed. Otherwise a signal that worked for you in a previous situation may lead to losses the next time you trade it.
DOUBLE BOTTOMS & ABC SIGNALS
An example of this is the case of the Double Bottoms and ABC Signal that are now seen on the 4H Chart on the EURO NZD. In the video below, I explain why these signals may not lead to a Bullish Movement that can be traded. Even if it does, it can be a volatile movement that is difficult to trade.
Ever faced this scenario where a Signal you traded successfully one day suddenly leads to losses next time you traded it?
Share it here
Duane
Hey Traders, back with you after a break to fine tune my new strategy that you will enjoy.
Previous Strategy targeted 100-200 Pips over 5-7 Days and while this had some benefits, it was much too slow in terms of Returns (40% Annually).
Now, new strategy aims to provide 30% Monthly…
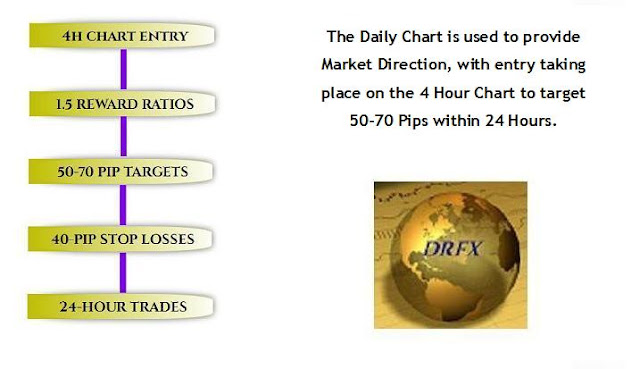
STRATEGY IN SUMMARY
1. 50-70 Pip Targets
2. Maximum Stop Loss of 45 Pips
3. Maximum Holding Period of 24 Hours
4. Daily & 4 Hour Charts used for Signals and Entry, respectively.
5. Candlestick Patterns and Signals used with Trend Lines & Consolidations for Market Direction and Entry
6. FXCM Charts used for Trade Setup and Signals (based on the New York Close of the Daily Chart)
7. Live Trades take place on my FXPRO Account (better interface when trading - can see % Risk and Return expected on trade & provides email alerts so you dont have to check your charts)
USD JPY TRADE
This took advantage of the False Breakout Reversal on the Pennant of the Daily Chart.
Daily Chart shows the Bullish Reversal Signal that indicated the start of this Reversal, following the failed Bearish Breakout…
DAILY CHART REVERSAL SIGNAL
Based on the theory of False Breakouts, it was expected to at least hit Resistance to then Breakout…
As such, after the 4H Chart provided a signal, entry took place with the following setup…
Stop Loss was placed below the Candlestick Formation, with Entry at the close of the Candle.
At the end of the 24 H holding period, market rallied as expected to provide a small gain of 33 Pips - equivalent to a 3% on my account. Even though target was 60 Pips and a 6 % Return, I had to exit for a smaller gain as the market did not rally to the target by the end of the 24 Hours - nevertheless, profit.
The Video Analysis of the trade can be seen below…
MAIN ASPECTS OF TRADE
False Breakouts can be traded aggressively.
Key is to know the Right Signals and Entry Setups to use.
Short Trading Targets within a Short Holding Period provide faster turnover and larger returns
Daily and 4 Hour Charts provide the most reliable Setups and Signals
Once Stop Loss placed at a Strong Area, no need to monitor the trade - Set It and Forget It. This is much easier if your Live Account offers email alerts.
These alerts allow you to know when the trade has been closed so that you arent tempted to interfere with the trade - NO EMOTIONS!
6. Always Exit Trades Religiously at the end of the Holding Period - just in case market reverses sharply!
So thats the trade in a nutshell. On average 1 to 2 of these setups appear each week. I dont need to trade every day since the next trade is just a few days away and will provide a Strong Rate of Return because of the Wide Risk Reward Ratio - more than justifying the wait.
Sounds good?
Look out for more later this week.
Duane
Hey Traders,
Even though I no longer use Weekly Range Trading on my Live Account as stated in tthe previous post, I still use it in the Dukascopy Trading Competition. Check out this 137 Pip trade on tthe GBP CHF.
Duane
Hey Traders,
This Video shows the accurate market forecast for the recent decline on the EURO USD this week. Based on the theory of how Consolidations are formed, I was able to predict this movement using the Candlestick Patterns on the Daily and 4 Hour Charts.
As you will also see, I had intended to trade the setup on my Live Account but unfortunately the price did not pullback enough to satisfy my Risk Per Trade Maximum of 4%. However, I was able to capture a small gain in the Dukascopy Competition where my Risk Per Trade Rules are more relaxed.
Overall, this video will show two things …
You dont have to wait for a Consolidation Setup to be formed before trading between Support and Resistance. Once you see the waves that begin the formation of these Setups, you can trade them aggressively.
Once you know how to predict market movements with Candlestick Patterns, you can capture the trading target in keeping with your strategy, whether you are a Scalper, Day or Overnight Trader.
Hey Traders,
This Video shows example of how we can capture large and quick Pips as the market forms Pennant Consolidation Setups on the 4 Hour Charts.
AGGRESSIVE 109 PIPS IN 24 HOURS ON GBP AUD REVERSAL
This Video shows a successful trade made in the Dukascopy Trading Contest that took advantage of the False Breakout Reversal on the 4H Chart Range Setup of the EURO NZD.
Once you can use the Candlestick Patterns to identify Consolidation Setups on these time frames, you can trade within these boundaries for strong trading gains.
Regards
Duane
DRFXTRADING
28% RATE OF RETURN - IS THIS ENOUGH OF A MONTHLY RATE OF RETURN FOR FOREX TRADING?
This Rate of Return was earned during the Trading Competition with Dukascopy Bank for the month of December, 2017. It reflected the Monthly Targets I have set for my Live Forex Account using my new Aggressive Swing Trading Strategy that targets High Probability Trades each week. With only a few of these types of trades needed each month using Reliable Candlestick Signals and Consolidation Setups on the Daily and 4 Hour Charts, I think this type of Monthly Return is possible and more than enough to provide large gains from the Forex Market in a very short time.
VIDEO ANALYSIS OF TRADING PERFORMANCE
The table below shows the summary of the monthly outcome in the competition. For the period, a 28% Rate of Return was earned with a Maximum Drawdown of just 5%.
SUMMARY OF PERFORMANCE

This Return was in sync with monthly target that I have set for my personal trading on my Live Account.

If this type of Return is targeted each month, significant gains can be achieved from this Trillion Dollar Market in just a few months…

The Aggressive Swing Trading Strategy I use is summarized below. Powerful and accurate Candlestick Signals and Consolidation Setups are used to Swing Trade the Daily and 4 Hour Charts each week. This is based on the Trading Theories and Strategies that I discovered actually control the Forex.
As you heard in the video above, there are times when trades that offer less than 50 Pips or more than 70 Pips are also targeted, so long as the setup is strong enough to justify taking the risk. All trades are held for a maximum of 24 Hours since this was discovered to be the time needed for the High Probability Trades to hit their Pip Targets. It also imposes a level of discipline that prevents being greedy.
MONTHLY STATISTICS

As you can see from the table above, the performance in the competition reflected the main aspects and goals of my Methodology…
Only a Few Trades Needed for Strong Returns
Fast Turnover/Overnight Results
Average Drawdowns of just 3.96%
No Need to Target Thousand of Pips Each Month
No Need to Trade this Market Everday
SUMMARY OF TRADES
As you can see from the video, all of these trades were based on Consolidation Setups that were either in the process of being formed or were already formed. This means the knowledge of the Signals and Patterns that control these setups is essential to taking advantage of them each week, such as with this False Breakout Reversal on my Live Account…
IDENTIFYING CONSOLIDATION SETUPS
The first step is knowing how to identify these setups. There are certain patterns that tell us when the market is forming these setups. Once we spot them, then next challenge is to know how to accurately draw them. However, this is easier said than done because of the many challenges involved in drawing and trading them such as…
Should you draw the Support & Resistance Lines across the Body or the Wicks of the Candles? or Both?
Which Consolidations are too risky to trade?
Which Candlestick Signals are reliable vs risky ones that lead to losses?
Which Breakout Candlestick Signals are risky and usually lead to False Breakout Reversals back inside of the Consolidation?
Should you always trade to the Resistance/Support Boundary or exit just ahead of these areas?
Where are the safest Stop Loss Areas and does it depend on the type of Trends/Candles within the Consolidation?
These are just a handful of the issues that we face when trying to master these popular setups that appear each week. However, if you have the solutions to these questions and include them as part of your trading, consistent gains from them can be yours.
Duane
DRFXTRADING
THESE TRADES SHOW HOW TO MASTER CONSOLIDATIONS
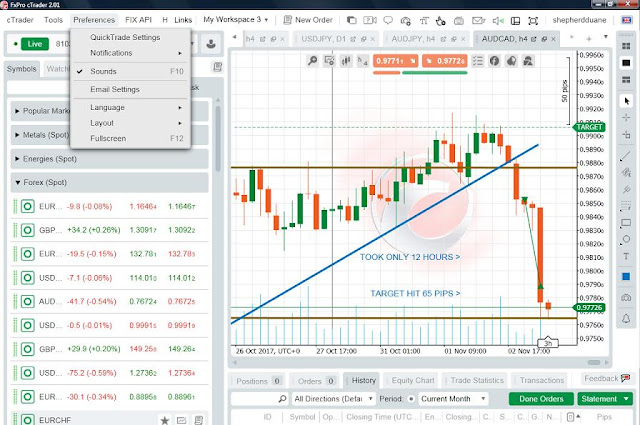
These were the 4 profitable trades made during the Duskascopy Bank Competition that led to the 28% Return in December. They show that Consolidations can be traded for consistent gains once we know how to draw them and trade with the right Candlestick Signals.
USD CHF 4 HOUR CHART - 32 PIPS
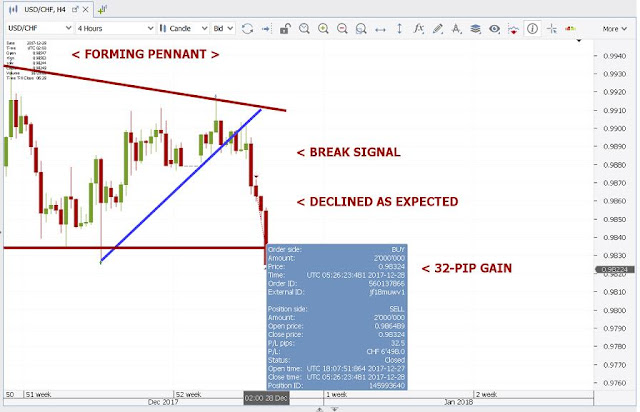
This Pair was forming a Pennant Consolidation Setup;
The Support Boundary & 1 Resistance Point had already been formed;
The 2nd Resistance Point to complete the Resistance Boundary and the overall Pennant was being formed by the Bearish Signal & Trend Line Break;
Entry took place at the Signal with the Target Set for Support;
After Just 12 Hours, the Target was Hit.
CHF JPY 4 HOUR CHART - 37 PIPS

This Pair had already formed a Range Consolidation Setup;
The Pair had recently U-Turned at Support and was headed to Resistance;
A Sharp Rally was taking place with Bullish Candles;
Entry took place at one of these Bullish Candle Signals;
The Stop Loss was placed below the Candle;
Target was set to the Resistance Boundary which was hit within 24 Hours.
VIDEO ANALYSIS OF THE TRADE
GBP AUD 4H CHART - 109 PIPS
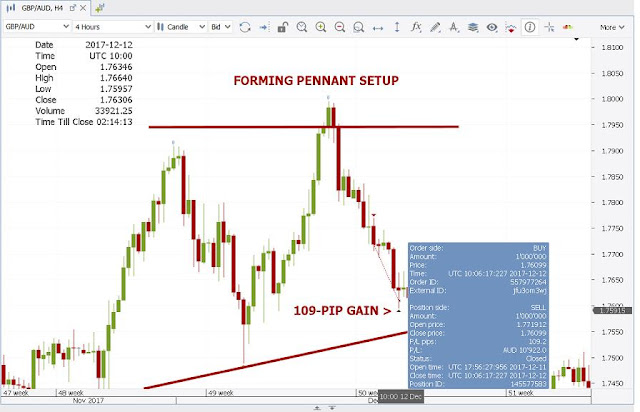
This Pair was forming a Pennant Consolidation Setup;
1 Support & Resistance Point had already been formed;
**The 2nd Resistance Point to complete the Resistance Boundary was being formed by the Bearish Trend that had started; **
Entry took place at a Bearish Signal with the Target Set to where the Support Boundary was expected to be formed;
After Just 24 Hours, the Target was Hit.
VIDEO ANALYSIS OF THE TRADE
EURO NZD 4 HOUR CHART - 74 PIPS

This Pair had already formed a Range Consolidation Setup;
A Failed Bullish Breakout took place above Resistance to then U-Turn back inside of the Range;
False Breakouts usually head back inside of the Consolidation and then break at the other boundary;
Entry took place at one of the Bearish Signals with the Target Set for Support and the Stop Loss placed above the Downtrend Line;
Within 24 Hours, the Target was Hit.
VIDEO ANALYSIS OF THE TRADE
So as you see here, Consolidations - no trends - were what I have been trading in both the Competition and on my Live Account. These patterns reflect the limited range of Pip/Currency Movement by most pairs over the last several months and the need to be able to trade these setups that are becoming the norm.
Duane
DRFXTRADING
Ever wondered whether knowledge of Economics is actually necessary to be a profitable Trader? As someone with a Masters in Economics and as a former Central Bank Economist, I can state categorically that this is not true!
This can be quite surprising given the nature of the market we trade- exchange rates. However, after 10 yesrs of trading, it has become clear to me that all you need is a knowledge of how Candlestick Patterns work on the Larger Time Frames. Here is a brief summary of my strategy that explains and justifies my approach to trading.
THE TRADING STRATEGY
Overview
The strategy targets gains of 50-70 Pips over a 24 Hour Period using the accurate Candlestick Patterns, Trend Lines and Consolidation Setups of the Daily and 4 Hour Charts. After experimenting with various Statistical Indicators across all time frames for several years, I finally discovered that there were certain combinations of Japanese Candlestick Patterns that offered more reliable Entry Signals, especially when combined with the correct way of drawing Trend Lines and the “Best-Fit” Method of identifying Consolidation Setups with Support and Resistance Lines.
Higher vs Lower Time Frames
Higher Time Frames in general were found to be more reliable with fewer False Signals and “Whiplashes” compared to the 1 Hour and lower charts. With this in mind, the Daily and 4 Hour Charts were then chosen as the time frames to use because they offer the best combination of the following factors that I have been looking for in a profitable strategy
Reliable Signals & Stable Patterns
Strong & Reliable Stop Loss Areas
Manageable Stop Loss sizes (30-45 Pips)
Setups with a High Probability of Success
-Trading Targets with Small Holding Periods
Economic & Financial News
As a former Central Bank Economist with a Masters in Economics, I can state categorically that a knowledge of Economics or Financial Markets is NOT necessary to successfully trade the Forex Market.
Yes it is true that many strategies out there successfully use Economic Data to predict market direction and that knowledge of various Economic Variables is crucial to the conduct of Monetary and Exchange Rate Policies. However, at the Retail Trader level that targets short moves within 24 hours, finding accurate Candlestick Signals was found to be more reliable than using short -term economic data that is too volatile to be used in a meaningful way.
In addition, what you will notice is that whenever there is a major news release during the day, the Candlestick Signal formed on the Larger Charts will eventually reflect the overall reaction by the market to the news. This means that you can simply wait for this Candle to close to indicate where the market is headed and then trade accordingly - without having to play the guessing game with these releases on the smaller charts.
The Pip Targets Per Trade
The strategy builds on the ability to accurately forecast the Weekly Range Direction of Currency Pairs each week. This accuracy provided the foundation of my previous strategy that captured 100-200 Pips per trade over the last few years and which led to an average return of 40% each year. While this was a good conservative performance that was a safe approach to long-term profitability in a dangerous market with a high failure rate, the recent narrowing of exchange rate movements has made targeting large trends and breakouts a very risky activity.
This therefore led to the search for a more aggressive approach that takes advantage of these smaller Pip Ranges. So instead of going after large gains over 5 to 7 days, shorter targets of between 50 to 70 Pips are now the focus to best take advantage of the narrow trading ranges.
Market Direction & Trade Entry
Both the Daily and 4 Hour Charts are used to identify market direction over a 7 day period. Once identified, the 4 Hour Chart is then used to trade in this direction for the targeted Pip Gain.
Stop Loss Placement
To protect the trade over the 24 Hour Holding Period against temporary pull backs, the following areas on the 4 Hour Chart are used for our Stop Losses
Strong Trend Lines
The Support/Resistance of Consolidations
The Low/High of Candlestick Formations
These are the only areas deemed strong enough to protect trades until the trade targets are hit. If these are not present on the 4H, the trade will be deemed too risky and will be foregone to avoid losses.
Market Setups Traded
Due to the narrow range of currency movements that we see each month, more Consolidation Setups have been formed across Currency Pairs with very few of them providing stable and reliable breakout opportunities as they had in the past. This is why my trading is done strictly within the Consolidation Setups formed on the Daily and 4 Hour Charts.
Consolidations that have a minimum distance of 150 Pips and a maximum of 400 Pips between Support and Resistance are the ones that are traded. These allow me to comfortably capture my trading targets within these wide ranges, while not having to wait too long for these gains to be realized.
Trading Frequency
On average, there are 1 to 2 of these High Probability Setups that arise each week. This means that with an average time of 3 to 7 days between trades, I do not have to be tied to my computer screen everyday and will have time to recover from both the euphoria of a good trade as well as the disappointment of a loss.
Risk Capital Per Trade
The Risk Per Trade that I use is 2% on average, targeting an average Monthly Return of 14%. This is in line with the Monthly Return that I now want to capture over the long-term.
The Holding Period & Trade Exit Rules
What I discovered was that in 90% of the scenarios in which the High Probability Setups offered stable 50-70 Pip moves, they didnt need more than 24 Hours on average to hit these targets. Any longer than this usually meant that the market was beginning to slow down and that a reversal was imminent. This is why as one of the rules of my strategies, any trade that has not hit its target within this fixed period will always be closed. This is done to avoid the bad habit of becoming greedy or needy and more importantly to avoid severe trade losses from sharp market reversals.(ex. The Sharp CHF gains from the SNB shocker)
What do you think?
Duane
DRFXTRADING
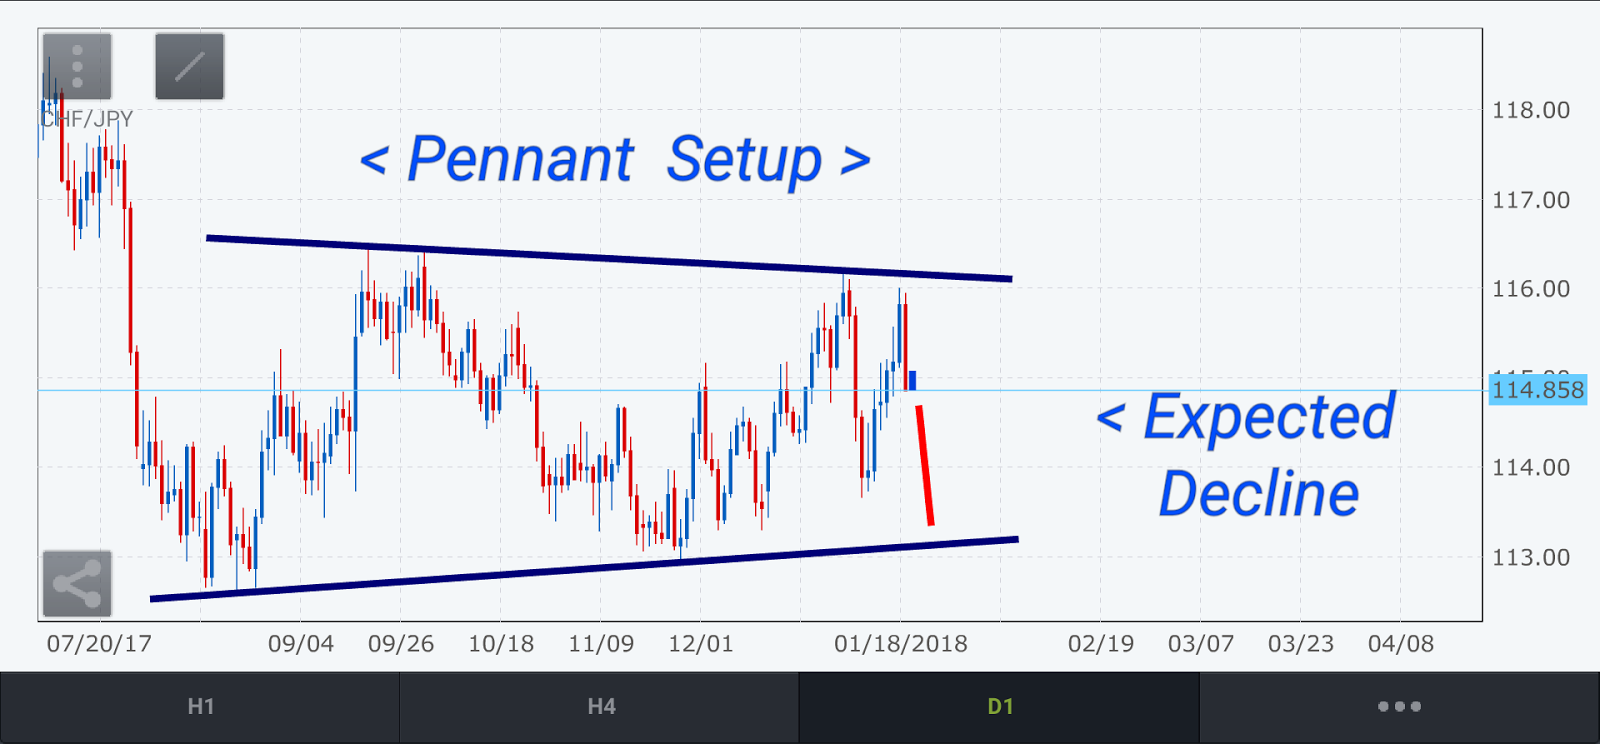
The next 24 to 48 Hours could see the CHF JPY pair providing us with a trading opportunity to go short as the Japanese Yen looks set to resume its gains that started at the end of the previous week against a few currency pairs across the market. Once the 4 Hour Chart provides us with a strong Setup and Signal to confirm the continuation of this downtrend, trading gains of between 50 to 70 Pips could be captured for a 2% to 4% Return.
CHF JPY SUMMARY AND ANALYSIS
From the Daily Chart below, you can see that a fairly large Pennant Consolidation Setup has been formed that has controlled the movements of this currency pair over the last few months. More recently you can see that a Bearish U- Turn has taken place at Resistance that now appears to be setting the tone for what to expect this week.
DAILY CHART PENNANT SETUP
Assuming this movement continues, the 4 Hour Chart will give the green light to start opening short positions, with the first one expected between today and Monday during the Asian Trading Session.
4 HOUR CHART POSSIBLE SIGNAL

Based on what we are now seeing here, however, the pair is a little bit oversold after that U-Turn at Resistance. In these situations, what is recommended is that we wait for the market to pullback with a slight rally here, followed by a reversal that gives us a strong Bearish Signal to resume the decline. This will then be traded aggressively to capture my targeted trading return, so long as it meets the following Guidelines for the Trading Strategy -
Offers 50 -70 Pips comfortably from entry to an area just above Support.
Requires a Stop Loss no larger than 45 Pips.
Provides a Strong Stop Loss Area such as the High of the Candlestick Signal formed or a Trend Line to adequately protect the trade.
As soon as a signal has been given that meets these criteria, you will see the result of the trade described here. In the meantime, re-familiarize yourself with the common Bearish Signals that tend to provide reliable entry signals in downtrends and be ready to trade any of them in the next 48 Hours.
Following the previous update and analysis of the CHF JPY yesterday, we are now seeing the pair pulling back as expected on the 4 Hour Chart following the strong U-Turn at the Pennant Resistance of the Daily Chart.
4 HOUR CHART BULLISH REVERSAL


What is now needed is a strong Bearish Signal to confirm the continuation of this downtrend and that provides trading gains of between 50 to 70 Pips.
An example of the Signal that could be given is this one on the NZD JPY on its 4 Hour Chart last year.
NZD JPY 4 HOUR CHART BEARISH SIGNAL

It was a similar Counter Trend Line (CTL) setup now on the CHF JPY that could also be given.
Let’s wait to see what is given and if it is strong enough.


