The size of the candlestick is rather impressive, and it does suggest that perhaps we are going to test the 200-Week EMA above, closer to the 1.11 level.
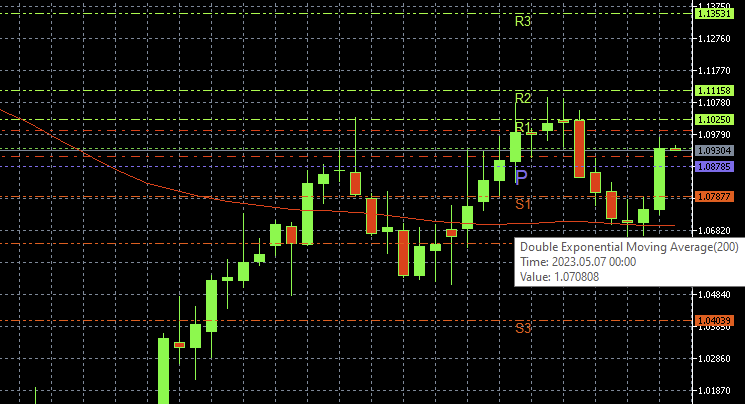
So…I go into MT5, use Weekly chart, and turn on a Double Exponential Moving Average line, which for me sits at:1.07080
So what am I doing wrong. Christopher James is clearly right…but I want to see what they mean by ‘closer to the 1.11 level’ – as for me the , the pair is currently trading above the 200 week EMA if I have calculated that correctly?!
Some chart programmes do not adjust the indicator time-frame when the user adjusts the chart time-fame. This means that if the default MA time-frame is D1, it might possibly be that the charts from that programme always show D1 MA’s, even if the chart time-frame has been changed to weekly or monthly or even 5-minutes. Check your MA time-frame setting.
That said, I have never heard a trader saying the 200-week MA was useful for anything.
Except whether it is useful or not is not of huge interest here. And you just did read it.
In this example - If i pick the W1 chart, and redraw the 200 interval DEMA, it still isn’t lining up.
you’re comparing the levels of two different indicators and apparently expecting them to be the same (one is EMA and the other is DEMA; why should they be the same?)