I can see what you are looking at. Price is also right on the Weekly Central Pivot and just above the Monthly Central Pivot. On a longer term scale that is ‘Fair value’ and it could go either way.
By the way, are you using GMT pivots for the Asian session? That will get you closer to the market. Also worth flipping back to NY pivots aswell though.
I’m using NY Pivots all the time, I tried GMT too, but it worked better for me when I sticked to NY.
You’re right. I think there’s a good chance that the stops below R1 get raided and then we could see a push upwards to get closer to 05.05/06.05. high. (not today ofcourse :)) On the other hand there’s the 2009 highs which line up with this high and we could maybe be on a way down because it was already tested. I’m just watching this week anyway hehe
or what i have been looking for is, without getting all steve nison on yer ar$e, simply - has there been a (or a series of - even better) large range day(s) in one direction - yes, then expect a pullback or consolidation. This i’m checking mostly on the daily. Is long term market flow up? Has there been a series of large range bear candles, followed by an inside bar or pin / inverted hammer - yes? then expect a large range day up. This goes into the pot with USDX candlestick & S/R analysis and bond yield analysis - failure high/lows to give you your directional bias for the day.
Then i like to go to the 30M/15m chart to see what clues the asian session has provided - does it add to the bigger picture analysis - yes - great, there’s a high prob trending day. Or -No? - then its slightly ambiguous - lets see what london does and maybe get a NY trade…
I’m just getting back into my regular trading routine here - took a quick 20 pip scalp tonight from an OTE on the EU to reintroduce myself to the whole trading thing. Let’s see if I can keep up this success and recover my losses from earlier this year/late 2010!
Hi Autodidact,thanks for the comments and help on lot sizes.
I think your confusion is that my trade was a long trade not a short so the fib was drawn from the low to the high as per ITC methods,on the screenshot its not spot on as I deleted it and re drew it somewhat in haste.
I have realised since that my stop loss was way over 30 pips as I calculated it wrong,as I’m currently risking a few pence only no problem.
Learning day by day and have been consistent with my sense of direction of price.
Hey Green thank you and my sympathies don,t beat yourself up its all about learning.Give yourself time and be patient!
Cheers
Jeff
if you don’t mind - where do u get your COT data from? Isnt it only published on a friday? Are you basing the reduction of commercial shorts on last friday’s data?
How are getting your direction of price each day? Thats the gold medal for me at the moment… how do you get better than average idea of daily directional bias? What is it today??? (… if you’re so clever…
Anyone with any 2 pence/cents worth on working out daily directional bias, please put them in the pot!
Does it change as the LO provides more clues? I started today with a downwards bias, now EU has hit Support at 1.4643(ish) all the market flows are up (bar 1H), the current EU low just went below Asian session low (clearing stops/turtle soup??), which has also been a support level in the last couple of weeks… so now I’m looking for that most recent LO swing down to be fulfilled… but my original bias was down based on looking at USDX candles, EU and GU previous daily candles, and US bond yields which looked like they were failing to make new lows = USD expected to bounce up = GU & EU head down.
analysis paralysis??? hheeelllppp…!!!
ps: jeff - just thought i’d chuck in a little brit-to-brit sarcasm in the last post, to make you feel at home out in spain!
Market Structure (this includes locating Stop camps, and monitoring how and where the swing highs/lows are being formed)
Market flow (1H/4H/D)
Pivots (D,W,M)
Institutional levels (20,50,80) and figures (1.xx00)
Fibonacci retracement (OTE, or sometimes Midpoint50%)
Fibonacci extensions (1.272, 1.618, 2.00, etc.)
Daily Range Projection (ie. is today most likely to be big/small range? where is a good location for the large range days to stop at?)
SMT (Fiber/Cable divergence)
Candlesticks (railroad tracks/long wicks/dojis)
COT (Commercial ‘Smart’ Money analysis)
I wrote it down to help remind myself of all the tools I knew how to use so far, and will be using it to make sure my trades resonate with a number of those tools. I’m working on a ‘Risk Management Strategies’ list to hopefully summarize my money/risk management on these trades I’ll be taking. I’m thinking some of the concepts from risk management will tie in with the technical tools ie. a kill zone can be seen as a method of controlling overtrading, as well as a technical tool
Sometimes I’ll open the charts, and get kind of paralyzed for a few minutes just trying to figure out what tools I have to work with and how I’m going to use them on today’s chart. IF you know that feeling, you could trying taking an inventory of your own tools and writing it down for reference in those confusing moments. GL out there! :41:
Yeah thanks Jeff, It is nice that I am seeing legitimate entries even though I am missing them.
Trying to counter trade that swing you caught was a bit of a hasty decision & I paid for it, He he… Would be nice to get my teeth into one decent swing trade! :19:
when you read my last post you know that I was looking at the action at yesterdays R1. Fractals were placed in a line there and there was a support just some pips away from it. So I was waiting for price to either break through the R1 to hunt SL and reverse very sharp or to see a clear break of it. I was in front of the charts again at 4am GMT and placed a fib on the swing which broke the R1 level, indicating a downtrend. It was a 40 pip move, so a valid swing for me. Unfortunately I had to leave before LO, but look what happened in LO KillZone. Target would have been todays S1, which was 90 pips away. Stoploss 15 pips, just above the swing high. 6:1 RiskReward oO
I hope I’ll catch some trades similar to the ones in the last days, next week
Great checklist, Ake. Could you give us an update on your Daily Range Projection spreadsheet? I am interested to see if you are finding any particular patterns. Can you see a certain number of large range days in a row, or a certain number of short range days before a large one? Basically, how are you making your predictions?
I went long on EU during Asia Open. Price was just above the previous weekly high, instiutional level 1.4650 and the Daily Pivot Point. Stopped out for -24 pips.
I don’t know if this is a hard ICT rule, but whenever I’m using yesterday’s Price action to draw a fib on, I’ll only be looking for Shorts off Yesterday’s High, and Longs off Yesterday’s Low. Using that rule, you coulda got in on this very sweet trade:
It is now morning with me, and time to analyze what might have been with last night’s London Close scalp. You will see from the first screenshot that GBP/JPY did actually make it up to 38% retrace of the daily range, which would have netted an extra 13 pips on the 26 already taken. However, I would have had to wait for another 2 hours and see it come right back to entry before shooting back up to TP.
If I had left them both unmanaged and aimed for 38% retrace on both the GBP/JPY and EUR/JPY, I would have been in a worse position than I actually was. The GBP trade would have netted 2.1% on 1% invested, and the EUR trade would have been stopped out for 1% giving a total of 1.1% for the evening.
As it was, I took profits at resistance on GBP and netted 1.37%, and the 12 pip profit on EUR came in at 0.57% giving a total of 1.94% for the evening.
How did I know to get out of the EUR when I did? Well I didn’t expect it to crash so hard given that GBP had risen nicely, but I did have a feeling that it was struggling. I had already made my money in GBP so I just decided to take early profit in the EUR trade. The majority of the time you should stick to the rules, but after watching this OTE trade in this time zone for over 3 months now, I believe I am getting a feel for price and what it might do.
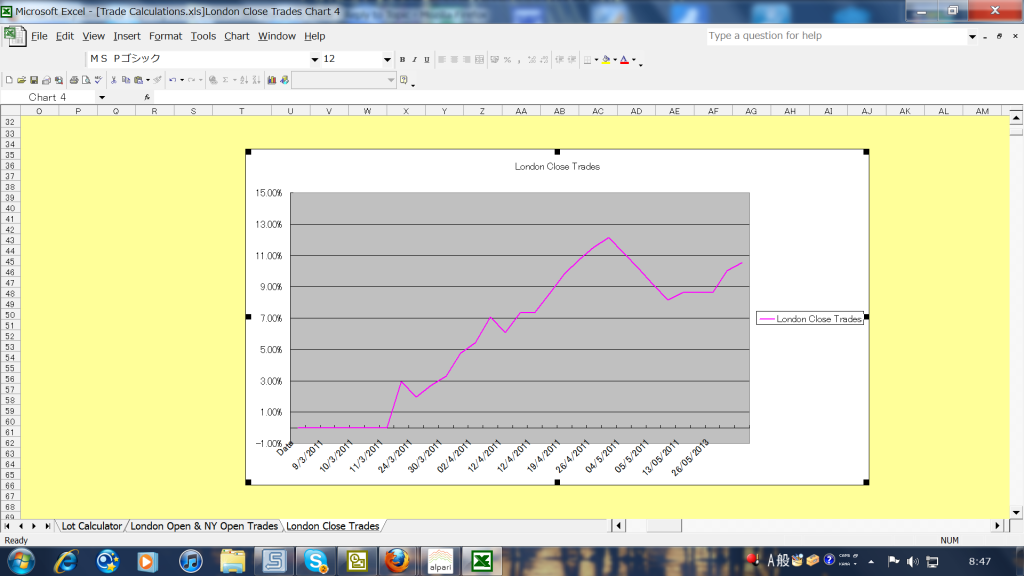
And for those of you who sat through my whinging and whining while I was in draw down, and gave support and advice, you will be happy to hear that my equity curve is on the rise again!


