What Every New & Or Aspiring Forex Trader... Still Wants To Know

I do think you understand, especially the parts I highlighted in Red. Just think of it this way guys, if it helps you nail down a 150+ range day just ONCE per month, it can do Amazing things for your net monthly gain. And even if you are ‘wrong’ about a big range day, you’re still SCALING OUT along the way, so really ‘no harm, no foul’.

And if you really want to get your money’s worth, really work on integrating it with price action on the daily chart. Does a Big Range day make sense in terms of S/R on the daily chart? Like ALL these tools, it works better when it’s supported from multiple angles.

You can call me Aaron of course! It’s my name in the real world, but I like Ake/AK too. “A rose by any other name…” hahaha

So…

is there a need for an indicator, or are we over thinking the range ideas too much? Isn’t just a case of eyeballing the chart and noticing when there’s a period of compression and then knowing that there’s a higher prob of a large range day following. Isn’t that all there is to it? Seems the chart gives you all you need, non?

I think Alis’ idea of a bar chart along the bottom of the chart makes for much easier interpretation of the trend. Something like the volume indicator but with pip values so it would be good for all pairs and TFs.

Yes the info is all there but in the bar chart it would be so much more accessible. We have quite a few tools to cross reference now so anything that eases the process would be good.

Two more pennies…

The standard ATR indi set for 2 to 4 days on a daily chart gives a nice quick-check visual for range contraction/expansion. I think we expect a range expansion after 3 +/- 1 day. Smoothing over any longer period of time is pointless for this particular applicaion, IMHO, since we expect maybe 3 to 5 days between large range days. When the indi is at a low be sure it will pop up. It’s quick, easy, works on any pair. It’s just another odds enhancer.

I do also like some of the more technical approaches detailed earlier in this discussion. For me, not sure I could keep it so detailed over the long term. If I did, I would likely go to Tools > History Center (MT4)and export the daily data to Excel and work from there. It gives the same info as shows at the bottom of the screen when you point at a candle: OHLC & V. Not sure about ‘V’, I figure that must be volume? If someone could explain that to me I’d appreciate it! Is it volume? How is it derived?

This one is a 2-Day.

Edit: I guess V is volume and dependant on broker.

ARGH! Babypips lost my post…

i’ll try again.

SO a lower window indicator, like volume, that simply displays the daily TF( or current TF) ranges of all the candles on the screen. With each bar being painted a different colour based on how tight it is, or based on a user-input amount???

May have to do all this once i return from holiday if i dont finish my other work this coming week first.

Cheers.

Yes I think that would be great, especially if, as you say, the user could put in the figures to change the colours of the candles. Some interesting patterns [I]might[/I] be revealed.

That said, it could be argued that everything shown is already on the charts and it’s just laziness on our part (this would be very unlike me :58: ). Further thoughts peoples?

Kinda bummed, have to take a few days off from the charts. Thursday night I was at the computer, and all the sudden got a blue screen and it shut off. Tried turning it back on but it couldn’t find the harddrive. Turns out my nice new Corsair SSD went dead. Waiting on Newegg to ship out my new SSD so I can get everything loaded back on. Using a standard hard drive right now just so I can use the computer, and you wouldn’t beleive the difference in speed compared to using a SSD, night and day difference.

The crappy thing is I didn’t think I needed to back up any of my chart configurations because the likelyhood of a SSD having any kind of issues was extremely low, sooo now I get to start again from scratch on quite a few things… oh joy!

I use a few different chart setups, but this is my favourite, using the oanda java platform. It’s simply all the institutional levels and figures, as well as GMT midnight to mark the days open/close (as I define it). I have the 10min TF up, but I’ll vary it from 5min-30min to get different perspectives on the highlighted levels. I think if you find yourself craving some ‘clean and clear’ in your analysis, this could be what you’re looking for.

*If you don’t wanna bother seeing the full version, just note that the levels are much brighter on the actual chart. The shrinking makes them look very dim

[B]NeedyPips[/B], good observation, sir. This is very similar to the way I watch ATR.

In my case, I have set up an indicator to plot the Daily ATR(2) on top of the Daily ATR(200). The ATR(200) serves as a regression line, and the ATR(2) oscillates around it.

It’s not exactly an ATR cross-over indi — but, it kinda works that way. Here’s how it looks:

[B]This is a long view (not the way I use this indicator) — just for reference. This view covers a little less than 5 years of data. The green lines mark the first trading day of each year.[/B]

[B]Zooming in, this shows the last 18 months, or so.[/B]

[B]This is the view that I use. This is a daily chart of the GU, including ATR’s and tick volume. This view shows the last 2 months, or so.[/B]

Ignoring today’s incomplete data, and looking back to Thursday and Friday of last week, I can see that the ATR(2) basically reverted to its mean — the ATR(200) — when it rose on Friday.

I can easily get numerical figures for these ATR’s — I can hover my cursor over any candle and a pop-up will show me the ATR(200) and ATR(2) for that day. But, I have never found a way to trade that numerical information.

Hey six3six, where did your post about London Close go? If you are worried about tainting ICTs information, then I don’t think you need to - all of the stuff you stated has already been mentioned by ICT, or else he has shown approval of the way I have applied it to other pairs. (Pairs near or past 5 day ADR - check. 3 hour kill zone - check. Apply OTE after 15-20% retrace - check.)

The part about the USD 5 day ADR he didn’t mention in the initial video lesson, but he did say in a live chat session that it was necessary for trading USD/CHF. I have now stopped trading this pair even though I do see set-ups becuase I can’t figure out how to get a 5 day ADR onto the USD charts. I asked ICT a few posts back to throw us a hint, but I respect the fact that he is taking some time out for personal reasons and can’t respond at present.

If anyone knows how to get the ADR onto a USD index chart, then once again, I humbly ask for your assistance.

Regards

Ali

Once I start looking at the Asian session in more detail, this is the sort of scalp trade I will be looking to take. Just as ICT said, don’t shoot for more than 20 pips.

Regards

Be careful folks: I just got an official warning for ‘advertising’ because I forgot to remove Manta’s tool from my screenshot. That is 1 of my 3 lives gone, and if I mess-up twice more I will be banned from this thread and these forums for good! I wasn’t aware of that rule, but I sure know about it now :17:

I like it AK. I’m a fan of a very neat and clean chart layout as well. I’m currently working on an EasyLanguage script for my TradeStation charts that will go from a dull green bar to a bright green bar in the kill zones. I really don’t like cluttering the charts up with horizontal lines to show the kill zones. Makes it too busy IMO.

Edit: This is in reply to AK’s chart on the last page. Clicked on go to last page, but it must have taken me to my last read post.

Hello All,

Alishijo - i also got a warning for advertising - sorry should of warned everyone b4 - couldnt work out what it was. I’ve since gone into the chart’ s objects list and deleted the label with manta’s website on it - sorry manta! Don;t want to get busted again.

I also got a warning from google/chrome browser yesterday when i tried to log on the forum -
baby pips. com contains content from ixv11.ipq.co, a site known to distribute malware. Your computer might catch a virus if you visit this site.
Google has found malicious software may be installed onto your computer if you proceed. If you’ve visited this site in the past or you trust this site, it’s possible that it has just recently been compromised by a hacker. You should not proceed, and perhaps try again tomorrow or go somewhere else.
// Well that was yesterday and this is today - seems… OK now… will email babypips.com admin.

RE: ADR indicator - I just put ADR(1) on my daily chart and there you can quickly and simply check when ranges are contracting or expanding. see attached. If you guys STILL want me to code the same, in a bar chart format with sexy colours changing as per range, of course i will.


Hehehe, what to say…this is just stupid.

I dont sell anything. I deleted my indis from this forum and this is my last post in this forum. Lot of people told me that babypips is just a crap and Im wasting my time here, but I found ICT’s techniques useful and wanted to share indis I made for myself based on these concepts. The tag with my website was there mainly for contact purposes and I did not want to see, that someone sells my indis somewhere on internet or something similar.

Good job admin, if you are so strict about some small author tag, but you dont care about Google malware warning.

Manta
If you’re still hanging around, (& I hope you do come back to this thread) I’d just like to thank you for the market flow indi you made, Handy piece of work, easy to use!
Whatever you do, all the best with your trading:23:

[QUOTE=Clint;262811This is the view that I use. This is a daily chart of the GU, including ATR’s and tick volume. This view shows the last 2 months, or so.

[/QUOTE]

This is the Advanced Version with all the bells & whistles (hehe). Nice work, Clint :slight_smile:

My thoughts on trading it are simply that when ATR(2) is below Mean to be watchful of a larger move coming.

100% caught up with the thread and videos now! Took longer than I had hoped but still very happy to be at this point. Now it’s time to spend more time on chart analysis and really putting these tools to use!

Thanks ICT and all of the consistent contributors to the thread for a great learning experience.

This thread — and specifically NeedyPips’ post — have prompted me to rethink my ATR indicator. In particular, I’m rethinking my use of the Daily ATR(200) as a “regression line”.

On the GU, which is the pair I trade, Daily ATR’s have been trending lower for several years — which means that the Daily ATR(200) reads high (due to the severe lag in a 200-period indicator).

So, I wondered whether a simple hand-drawn regression line would work better than the Daily ATR(200), in conjunction with the Daily ATR(2).

For this comparison, I’ve enlarged my ATR indicator window, and set the range to approximately 4 months.

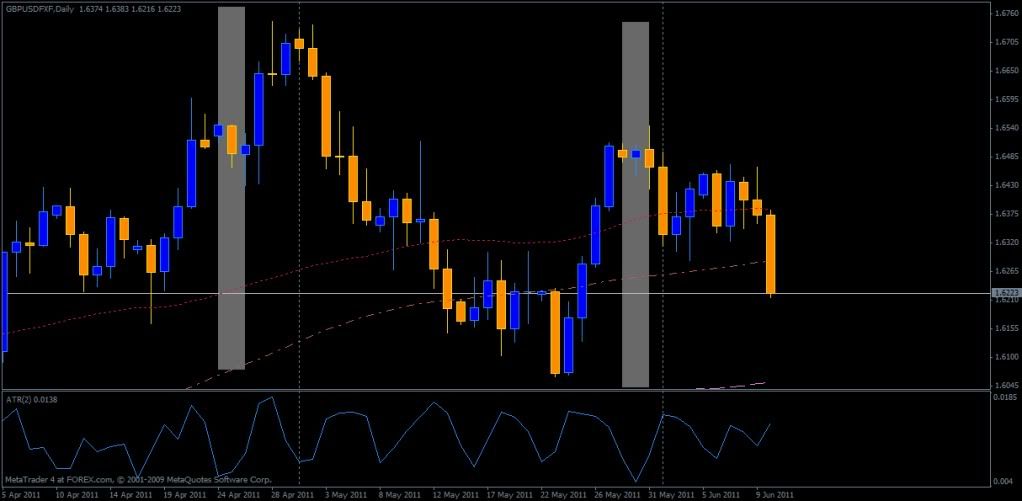
Here’s the ATR(200)/ATR(2) combination that I’ve used in the past:

And here is the ATR(2) with a hand-drawn regression line in place of the ATR(200):

And, finally, both the hand-drawn regression line and the ATR(200) shown together:

I think I’m going to go with the regresson line for a while. Maybe it will offer better clues regarding increasing/decreasing daily price ranges.


Some comments on daily range and daily true range:

Daily range is simply H-L for one particular day. Each day is independent of the preceding day, and of the following day. For markets which close overnight, and re-open the next day, daily range ignores any gap in price which may occur between one day’s close and the next day’s open.

The idea of true range is to account for the overnight gaps in markets which close overnight, and the arithmetic for doing this accounting is standard and universally accepted.

In the forex market, the distinction between range and true range is essentially meaningless, because the forex market closes only at the weekend. When there are no gaps in price to account for, range = true range.

Therefore, when some posters on this thread talk about daily range (or average daily range), and — simply out of habit — I talk about true range (or average true range), we’re all talking about the same thing.

Obviously, the terms average daily range, or average daily true range, cannot really apply to one day’s range, because there is no averaging involved. But, we all know what is meant when someone refers to ADR(1) or ATR(1). When two or more days’ ranges are averaged, then the number of days being averaged is typically shown in parentheses.

Most range indicators built into forex trading platforms refer to average true range (ATR), and most will not allow you to select 1 as the number of periods to be “averaged”.