Ok im super noob but after watching the first 4-5 videos there are a couple of changes i am doing as of right now.
I am one of those noobs that was trading with 50k fake money and trading with 500-1000 lot sizes. From now on, 1 lot size, will try to not get caught up even in the pip count. All that matters is that I am following my trading plan (which is proving to be my toughest challenge) and that I am consistently putting on more winning trades than losing ones. Another thing im starting is a trade journal, no wonder ive never kept one even back when i traded NASDAQ stocks, I trade way too damn much!
Man… I need to put together a simple trading plan. …i thought that was the easy part…
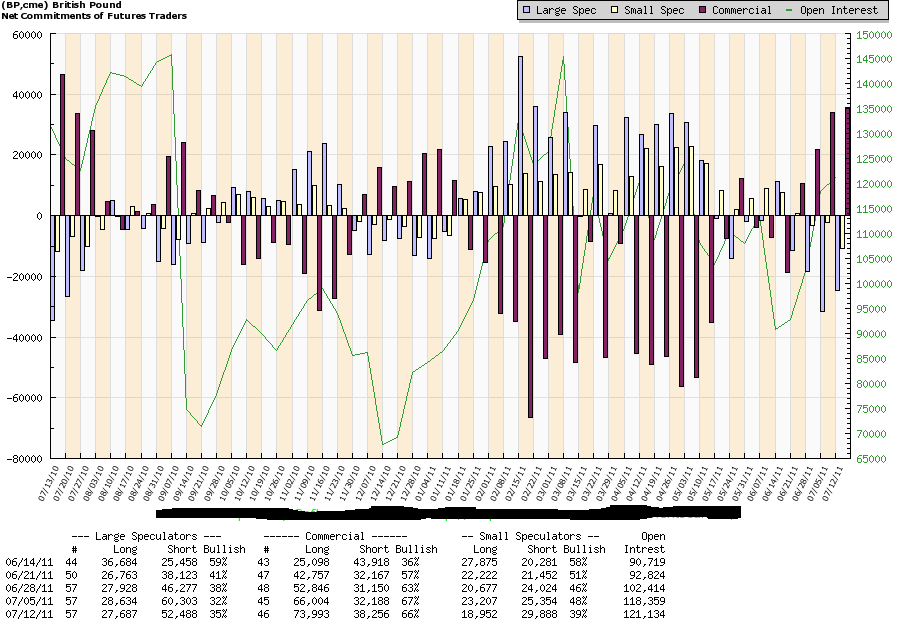
The Commercial Index and the Large Trader Index are calculated the same. Take the current week’s data, and minus the lowest week’s data (52 week range). Divide this number by the difference between the highest week’s data and the lowest week’s data. This will give you an index value.
Still can’t post more than a paragraph at a time…Grrrrrr.
This bit got me going: “[B]IF price is in an up trend, then enters a trading range and Open Interest declines (usually about 20%) expect a rally. Sells come from a down trending market entering a trading range while Open Interest increases about 20%[/B].”
So if you could add this bit of info to your index work, gift wrapped with bow and ribbon and just drop it off to my inbox every week that would be much appriciated, thanks there’s a good chap.
Haha! I’m in this world for you Wally, whatever it takes to make you happy, brother
Once I read some of the Williams seminar, it took me back to the COT video which I had kind of put on the back burner. I thought at the time it was a good idea to look for the extremes, and I could see how it turned the market, but it still seemed a little vague. I guess what I was missing at the time was a good understanding of support and resistance, Fib etc, along with the more precise data (or maybe just a better presentation of the data we already have) in the form of an index.
Anyway, here is some more info if Babypips will allow me to post…
(Can I just add…when ICT says he has some great things in store for this thread, you better believe it! I have discovered some amazing things these last 48 hours with regard to intermediate term trades, and, dare I say it…indicators! I won’t say anymore because I don’t want to spoil the surprise )
I completed some good starting posts and all the video’s material to start with.
I liked it and will test with very small trades to start with, I know they may be succesfull strategies But i need to check if it suits me…
I do have few questions, if experts or ICT can provide direct links that would help me to built on, I do googled but not able to find best one as I see in video’s.
link : COT data chart(Weekly)(I really like the video one)
link: Opent interest of future/day data.
Two currency line chart GBD/EUR on same chart window.
I see us have some swing arrows on the chart, is it indicator or just a marketr you put yourself for marking?
Trasuries curve yiels,1,5,10 (Is it live?)
Thanks again, I hope I will get some direct links so I can start building on these data which so far I have never used.
Thans Wally!
Really appreciate your help with the links
Now need to study… :)… working on 60 pips/week.
I need to work on not cutting my profitable trade for less… and SL…
Didn’t take this trade today but was watching it to see if I was understanding correctly what ICT looks for, so I was chuffed to bits when ICT notes it on twitter.
Nice trade Wally! I was too tired to trade the LO but caught a short at NYO, 1/3 off at +30, 1/3 off at the 1.618 extension (1.60322), and holding the rest looking for more pips
Edit:
Wally, you know we were in an OTE short on the daily when these trades were taken right?
I’ve begun implementing Pivot Points to my charts and it’s quite extraordinary how price reacts on the levels… However the Bill Williams fractals i still haven’t gotten a hang of, in what video do you introduce them ?
Also. I’m soon going to the U.S. What books would you recommend purchasing for trading ICT?
Nice Trade Wally!
If from a newbie prospective, if you explain this succesful trade that would be great.
LO + OTE + CPP + 20 level + 4H down on the cable.
LO, OTE,CPP etc… I know pivots,fiber etc… may be I know these But don’t know in full
I mostly concentrate on AUDJPY pair, I got 15 pips today… :), cable margin is high with oanda
I entered at a the Daily S2 and set the TP at what i thought (?) was a resistance since price had bounced of that level earlier. What confused me was, should it be set at the wicks of the candlesticks or just were price closed?
I’ve noticed that in the fibonacci the 61.8 and 50 retracement levels have a huge respect for the price, often they tend to reverse/retrace at these levels, as you can see the wicks where in that area?
. However i was catious and didn’t set my TP there since i thought it’s better, because if price wouldn’t exactly hit that price-area of resistance.


 )
)


