I can’t find his old forum post whenI search for his name. Can you be so kind as to repost the tool here so those of us new to it can have it?
I believe it’s the same principle…when highs diverge, price goes down, when lows diverge, price goes up…that would be for both pairs because of their correlation.
So if EU stops making lower lows and starts heading up and GU hasn’t yet, GU will eventually follow suit, or vice versa.

ICT is the expert here, so take my advice with a pinch of salt.
This is where your other tools come into action (market flow, pivots, etc).
In this particular case, market flow was down on the 4hr, and both pairs were at a resistance level almost at the same time, pairs had already reached their Average Daily Range on the Asain session, so it was a no brainer. Shorts were imminent.
Cable was the leading pair, meaning that this was the one falling first. Euro was the lagging pair making the higher highs, thus the ideal for the nicest entry. If you were looking to short the Cable, this is where the Optimal trade entry was a good option, instead of pulling the trigger right at resistance.
But of course this is my view, and it’s not always as black and white as it sounds. It’s all about putting all of your tools together to make the most sense out of them.
Hope that helps.
It’s not a particular indicator. If your platform allows it, overlay the second pair on a line chart (calculated to the close) and watch for divergences at key support/resistance levels. That’s it. If your platform does not have this option, use Netdania charts available at DailyFx.
Hope that helps.
I made a “hack” version of the ICT smart money tool. Admittedly not as visually appealing as having them overlap but in terms of spotting divergence it gets the job done…

For MT4 users, there’s a great little indicator called OverLayChart-MA that replicates the Smart Money Tool quite nicely. Just Google it and you’ll find it quickly.
Settings:
Apply it to a EURUSD chart set on a line graph rather than candles.
SubSymbol: GBPUSD
ShowCandles: False
ShowMA: True
(UK inflation numbers @ 0930 GMT… “Be careful out there” :))
Don’t want to jump the gun on MCAWally but the time indicator ICT was referring to in his latest video is called P4L Clock. I also have an useful indicator that will give you the trading sessions for London, New York, Tokyo and Sydney in a separate indicator window, it doesn’t overlay on the chart so keeps things pretty clean, it good for quick reference. Anyway google both P4L Clock mt4 and Market hours mt4 and you should be able to score both.
They have tripped that first cable stop cluster 1.6090/100 up there and now they are gunning above 1.6115.
I wish cable makes up it’s mind where it want’s to go.
Thank you, I have no idea how I missed that post!
Hey m8,
Here’s the link again to PL4 clock in case anyone missed it - P4L Clock.mq4
Maybe ICT could put it on first post, if appropriate.
Wally
Here’s the GU short I took last night before the haywire that occurred on GU.
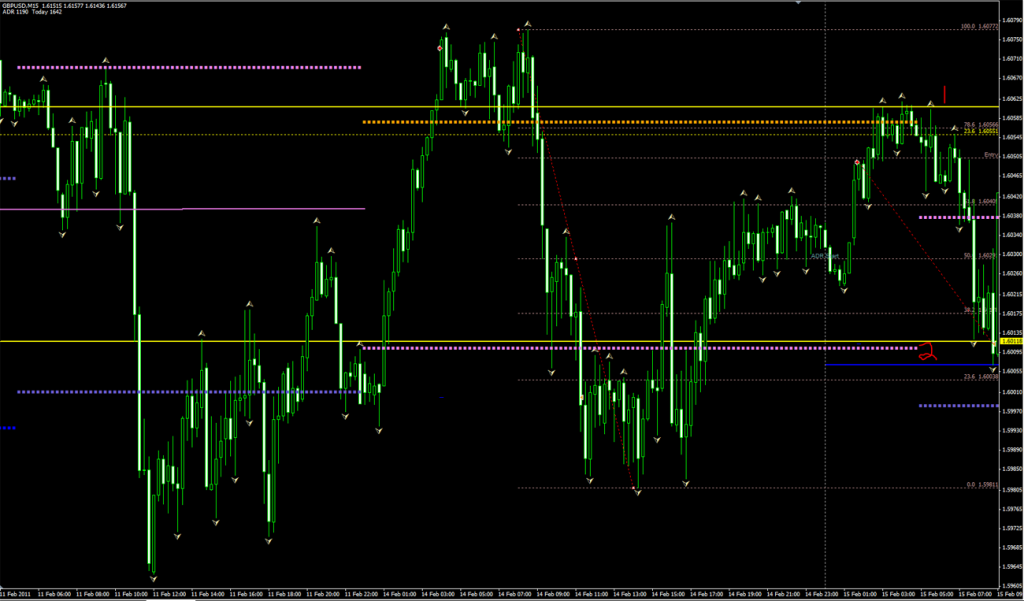
This is 15m chart. At 1 (entry area) I had R1, with confluence of the 78 fib and weekly 23.6 fib. Entry was at the 72, triggered a little early and price exceeded entry by about 12 pips. Target was near 2 which at the time was the Daily pivot along with a monthly support line. On 4hr the trend was still lower highs which was my bias, however I noted that it was not making lower lows which is my reasoning for targeting the Daily pivot + weekly support zone in case it did not want to make lower lows.
At new day the day the daily ATR pop’ed up and confirmed that the lowest I should target was that previous day pivot. Total trade 38 pips (r:r 2:1). I wasn’t around for TP or what happened after.
I’ve noticed on the last couple days, and with today’s action, the GU seems to be leaving the short bias nature. On the 4hr chart I see higher lows and higher highs being created. Does anyone else believe it is time to anticipate further long moves?
I definitely agree but as of yet I’m not 100% sure which direction to trade so I’ll probably wait until something proves direction.
Edit, Actually 4hr and 1hr look bullish so maybe it’s time for some longs? I caught part of the long today but go in late and closed it before I left for class so I didn’t get much out of it. Also took the scalp recently at a tad above the .618 retracement (1.61538). Price is above the ADR high and it’s around that time of day when price [I]should[/I] enter back into normal range.
Update on those trades, the first was stopped out at previous month’s high for some profit and the other was close for a loss of about 2 pips
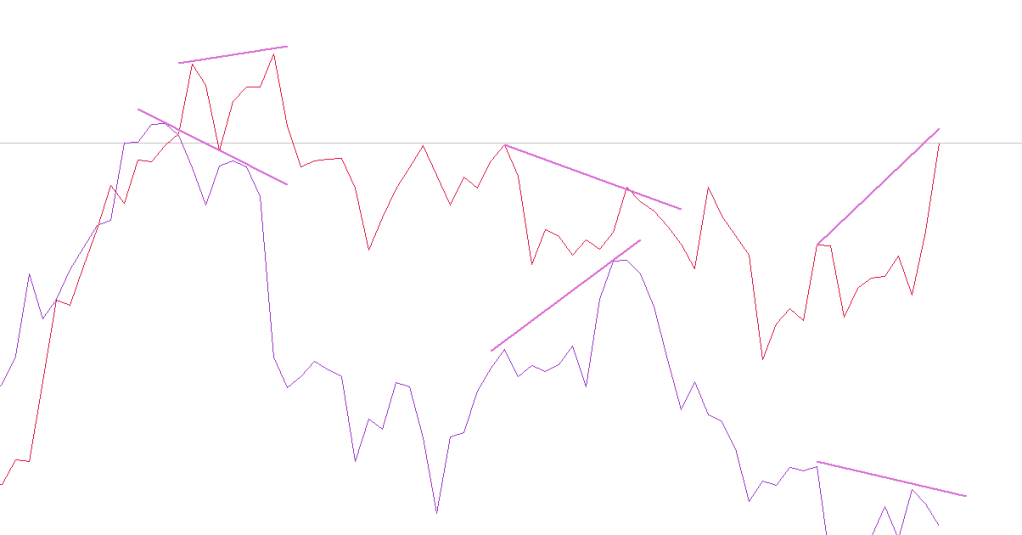
I forgot to add this picture. A 4hr overlay of the GU and EU (line chart) divergence. With today’s move you can clearly see the GU is moving to the upside and EU is not (Red GBP/USD, Purple EUR/USD)
The first shown divergence gbp continued to make a new high while EU did not, and then both fell. Middle divergence the GBP continued making lows while EU did not, then EU fell. Finally we have the current divergence where GBP broke the bullish trend line while EUR did not. Similar setup with the first divergence so it could be anticipated for a GBP falling after this huge rally or I think we could anticipate the EUR rallying with the GBP.
I think both situations should be planned and will need other confluences before we will know.
I took this trade minutes before going to bed, and after taking a 25 pip loss on a short trade that got stopped out on that initial break higher into the London open.
my reason for the trade were optimal trade entry confluence at Central pivot and the fact that 4hr market flow turned bullish on that push upwards before the news release. Also 1.6000 remained strong support all day up to my point of entry, so I figured the low had been put in for the day. I was watching the Smart money tool but I’m not really experienced with it so I didn’t use it in my analysis. If there was further confirmation in the SMT, I’d appreciate someone pointing it out to me!
I was targetting 1.6150 (inst. level) because it was above thursday’s high (which looked significant on the pullback) and below the 161.8% extension on that London open upswing, and it seemed in line with Cable’s average daily range potential(~155 pips)
my stop was at 1.5995 (35 pips) and I netted (0.330)+(0.7120)=93 pips
subtract my 25 pip loss and that’s 68 net gain for the day!
Very happy that I used the tools properly, and that they worked out! Caught my first “ICT grade” swing and it wasn’t as difficult as I thought.
Thanks ICT, your tools work just like you said 

Uploaded with ImageShack.us
Very nice trading folks… I’m stoked you are seeing the tools perform for you.  I love it!
My blog displays the London Close and Asian Open trades… just scalps nothing superb.
Wednesday night I will post a new PTC video and answer some of the posts and even Shandy’s :eek:
GLGT
I took the London close trade aswell as I was working through the morning session. Put up my charts about an hour before optimal entry and scrambled for my ICT notes! Here is my write up:
Market is overbought as it is trading above it’s ADR High. Time was approx 11am NY time, and 4PM London. Price set up for Optimal Entry with a confluence of 161.8 extension from the swing low at 10:30am London time (1.6159), and the Mid resistance between R2 and R3 (1.6162). I entered at 1.6157 because it was exactly half way between the 61.8 and 79 lines of optimal entry. Price turned down at the 79 retracement which came in at 1.6161 (just 4 pips from my entry :D). My stop loss was placed above the day’s high at 1.6172 so I risked 15 pips with an initial final target of 57 pips (Optimal Entry swing low to Optimal Entry swing high/day high Fib placement – 1.61.8 extension coming in level with London morning session’s swing high and the 1.6100 figure), but an initial TP of 32 pips at 1.6125 which was the ADR High Line and just ahead of the 123.6 extension (1.6120). Went to bed after taking 50% off the table at 32 pips. Left it with OCO orders at 1.6162 and 1.6100. Woke up this morning and it was in the middle of my two OCO order range (neither triggered) with little sign of wanting to fall off to my initial target. Took the remaining 50% off for just 12 pips.
I have screen shots but not too sure how to paste!
Thank-you ICT, this is my first London session close trade and it felt good, even though it was just a little tiddly scalp
Just woke up from a nap before London open, feels great haha. Try it one and all, the charts pop out at you after a little shuteye
The ATM method, I get it now! I feel like I’ve been standing at this ATM for the last 3 years, and just suddently remembered my PIN
 i am honoured
Hi Guys,
At the risk of being reprimanded for over-trading (which I’m still working on), I just wanna share the two trades I took last Feb 15.
The first trade I took was a short at 1.6100. Based on my analysis, 1.6100 has been a key S/R point over the past weeks. In addition to that, it’s an institutional figure and was also in confluence with the MR2 line. So, although market flow was up, I felt that this was strong enough resistance to warrant a brief reversal at least. Price then traded sharply down and I took profit at around 1.6020 banking 80 pips. Reason why I exited the trade was because I realized that the 1.6020 area was actually an optimal entry for a previous bounce off of 1.6010/1.6000 area which is also a very strong S/R level.
I then took a second trade at this optimal entry and went long at 1.6030. I began seeing some consolidation around the R2 level so I set my take profit at 1.6130 and bagged 100 pips.
Now I’m refraining from taking any more trades since I’ve hit my weekly target of 80-100 pips. Will still watch the market though