And with me…
That’s how I felt when I first started. Actually, that’s probably how i still feel.
Hi Jaroon,
Appreciate you taking the time and looking at my trade. I was struggling with image upload but finally made it. Image is there now. Thank you for encouraging remarks 
[QUOTE=ClarkFX;254985]Before I went to bed (which was 1 hour before LO), I drew a fib from latest downward swing which was about 60 pips, I placed a sell limit at 1.6538, SL at 1.6568, and TP at 1.6478. Risking 2%, and having a 2:1 RRR, I just closed the trade.
Hi Clark,
Nice trade. Amazing RRR. How you determine TP of 1.6478?
Just the ten pips for me off Fiber LC close. 0.3% but another win to boost the stats. Sorry for lack of screenshot. Too tired tonight!
TP was set just above ADR Low, and just past the 121.0 extension that I measured the OTE from. It was also MS2. And if you look a couple days back from the trade, when Cable was pushing up, it had retraced around that area as well. Now acting as a support level. Confluence of 4 levels. =)
Edit: Oh, and almost forgot. 1.6480 institutional level/round figure. =) And I’d much rather get 60 pips, versus 58 haha. A bit more cleaner.
Hope that helps. If not, I’ll happily post a screenshot.
Regards,
Clark.

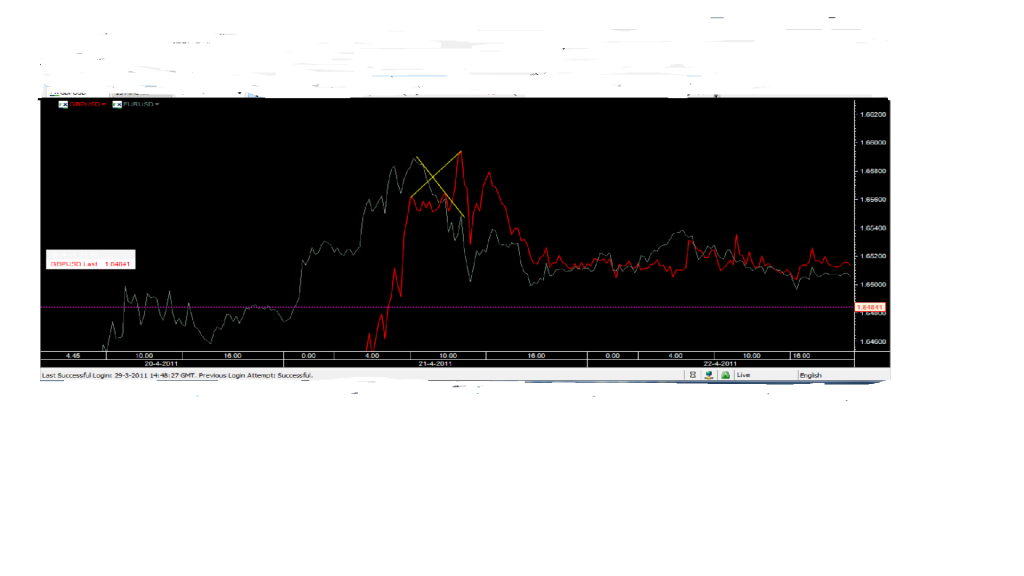
Yes, mine looks just like yours. So does that mean GU may follow EU or does it mean that both might reverse?
i believe the smt above is showing the that GBP is getting ready to drop if its approaching a good resistance line
could be wrong though because of the lows im not considering lol =/
Anyone gonna be in the chat room tonight for london?
Thanks so much for the examples guys! I will be looking at the SMT videos tonight, and continue trying to understand them. =)
I can find divergences of failure highs and lows but I just don’t understand the results of them.
For example: Cable and Fiber are in an uptrend.
If Cable makes higher highs, while Fiber makes a failure high, would we expect that Cable will follow suit and perhaps fall? In this case, since Fiber may have already started falling, shorting the Cable on a OTE would be the ideal trade? This would be considered regular divergence?
What if Cable is making lower lows, while Fiber is still making higher lows. (Still in an uptrend) Would this be hidden divergence? Where one could say Cable may go for another up swing?
And Vice Versa for a downtrend?
Regards,
Clark.
What does SMT stand for, and I dont see any video’s relating to it on the first post of this thread. Can any one help ?
Smart Money Tool
It has to do with divergence between EURUSD and GBPUSD to spot potential turning points. I don’t really know much about it or use it too often so maybe someone else can help
Using the Smart Money Tool:
Going long:
Step 1: Wait for price to reach a significant area of support on either the GBP/USD, or EUR/USD.
Step 2: Look at a chart (I like a line chart, personally) comparing the GBP/USD and EUR/USD (as seen in pictures before this post). Compare the LOWS of the two currencies. If one pair is making lower lows, while the other pair is either making higher lows, or is simply failing to make lower lows (double bottom), then you have BULLISH divergence on the SMT, and are primed for a trade going LONG.
Step 3: Enter long into the trade, provided more than 2 technicals align.
Going short:
Step 1: Wait for price to reach a significant area of resistance on either the GBP/USD, or EUR/USD.
Step 2: Look at a chart (I like a line chart, personally) comparing the GBP/USD and EUR/USD (as seen in pictures before this post). Compare the HIGHS of the two currencies. If one pair is making higher highs, while the other pair is either making lower highs, or is simply failing to make higher highs (double tops), then you have BEARISH divergence on the SMT, and are primed for a trade going SHORT.
Step 3: Enter short into the trade, provided more than 2 technicals align.
This is it in a nutshell, as far as I can tell - ICT can probably fill in the details or any miscommunications I’ve delivered (which I will quickly edit into my post if they are pointed out)
A couple of points I’d like to make here:
-
The way I look at divergence is if something is making a new High or Low and the other thing [B][U]isn’t[/U][/B] then it’s showing weakness in that High or Low. Forget the whole hidden/regular rubbish it just confusses the issue.
-
With point 1 in mind the Smart Money Tool is best applied at a predetermined level, as Aarnog pointed out, adding validity to that level and trade.
I think as students we’re jumping the curriculum here as ICT will probably be posting more on SMT as it’s proper use later with some other goodies.
Wally
Thanks for your help MCAWally, Aarnog and Hellogoodbye I do understand what you are explaining but how do you get the two charts to overlay ? Is it an actuall indicator?
I think someone mentioned this before too but… go to dailyfx.com , then the free charts section, then the netdania chart, right click on the screen when it loads and it will say “overlay” , then just pick the pair you want
Or alternatively just go straight to Netdania - I use them while in work as don’t have access to any other charts. They’re pretty decent overall. I prefer them for seeing long-term pictures and drawing support and resistance zones over MT4 myself.
Thanks guys for the information on SMT, it really helps me clarify how to use it. =)
Took a short just prior to LO, grabbed 62 pips, setting a 20 pip SL. RRR of 3.1:1. Kind of thankful I was only looking for 60 pips, because price went up 140 pips right after my exit… Phewf. =)
Anyways, 2 trades for me this week, one Monday LO trade, and one last night (well night for me). I banked, 120 pips, for a 10.4% increase on equity. =)
Now that I’m done trading for the week, I’ll definately be taking a closer look at the SMT.
Regards,
Clark.
Why did you take that short based on SMT?