Just to clarify…the net change in contracts for the Commercials from the 17th May to the 24th May was +19,684. Scalps going [B]long[/B] would be in line with COT in this respect? We are looking at [B]net change from the previous report[/B], not overall net quantity?
I woke up, saw that spike, narrowed down to a 1 min chart, saw it as a 1 min candle = admitted I had no idea what was going on this morning, went back to bed.
Ended up taking about a 1.5R trade last night eventhough Cable fell. I was fortunate to get out when I did, although I did exit a bit too late. But it was a nice trade, gave me some confidence which was needed after that losing streak. I’ll post that trade up as soon as I am back on my own computer as well as last night’s analysis. I was in a rush, so I didn’t have much time on the forums.
Did anybody catch the London Close trade today for the Cable? If I am not mistaken, is this what we consider a “Z” day and the springboard? Looking at the 15min or 5min chart, I’m seeing 2 OTE’s. I didn’t take the trade, but was just wondering if anybody did and what their take on it was. I think I’m going to stay sidelined for the LC until the LC course comes out tonight! Maybe I’ll be able to trade it tomorrow.
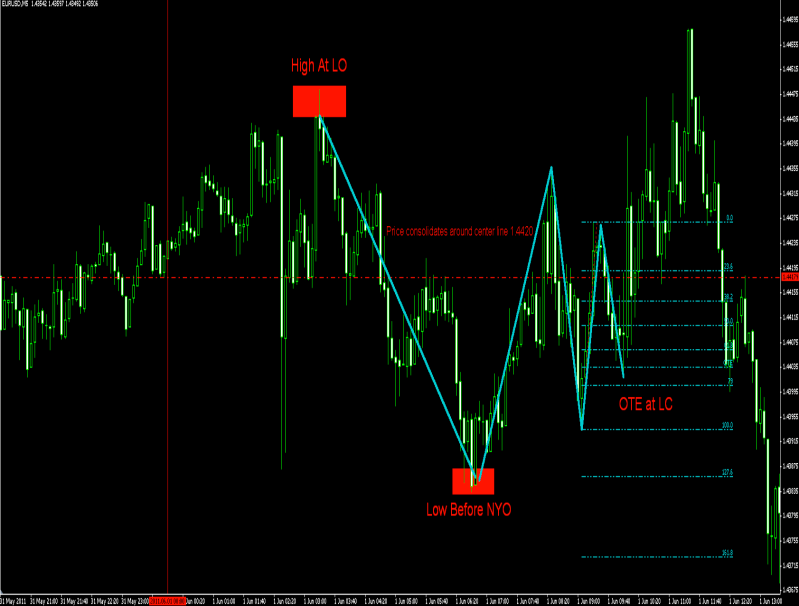
I caught the NY open, and LC. What a gem of a tip the NYO was! I woke up, watched price move up a few PIPS, knocking out any resting stops, entered short and rode it almost all the way down to ADR. Once ADR was hit (within a couple PIPS of my calculation), I waited for OTE and entered long. My entry order was not tripped so I entered late manually but stilled managed an average of 20 PIPS. LC gave 2 opportunities to get in this morning.
Cable seemed like pretty classic set ups today. One of those days where even I could take a few PIPS from the market. Fiber on the other hand seemed to be in a Z day- moving back and forth across a S/R level
yes, I believe you can consider the Fiber today a Z day. The Fiber on the 23rd is the Z day we reviewed… (PTC video posted 5/23/11), but today had a lot of similarities. Price will be range bound, and will find it’s way back to a central pivot point whenever trading above or below it. Not necessarily the CPP, but a PP that is central to the price that day. The action during the session is for building liquidity and preparing for a move. I’m studying the chart now and seeing that it was building liquidity, moved up to the 1.4457 level, which is a long term S/R level, knocking out resting stops from the previous fractal highs, then made it’s big move down. There is another PTC video- 3/31/11 that covers consolidation breakout.
Today just seemed like the major players pushed the Euro around to trip all the stop orders as there was no real break to either side until late NY session.
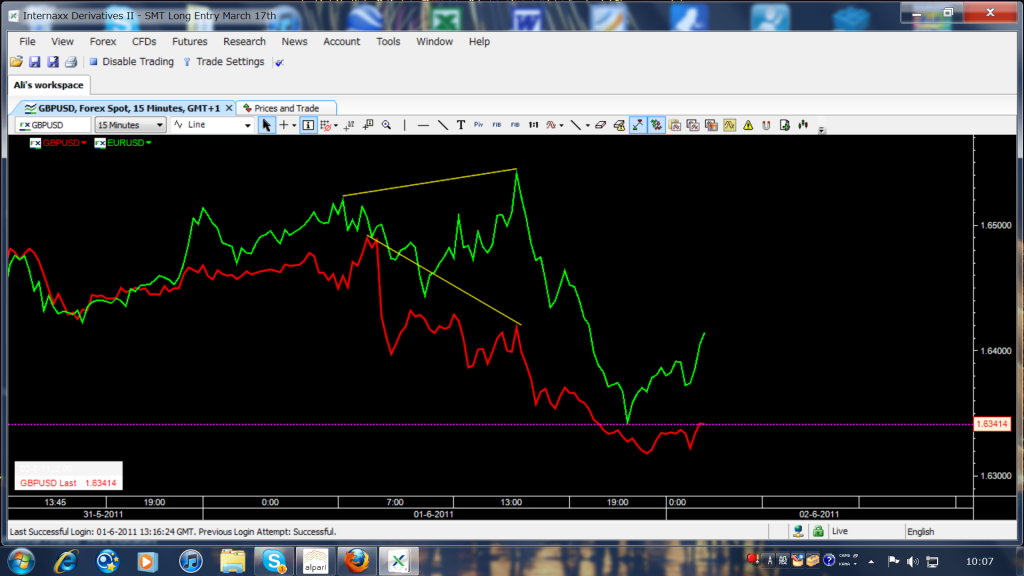
This looks like a Wolfe Wave Pattern to me, doesn’t it? Just wasn’t able to see it until you draw this lines hehe. I guess I’m just 1 or 2 videos before the ZDay video so I’ll return with question after I finished watching all vids (If there are any left :P)
I did some analysis why I shouldn’t have entered long in my last trade some days ago and found the reason pretty fast. Thought it would be nice to share it, because it’s simply amazing how accurate these tools are and it shows that I should take a closer look at the larger timeframes, not only marking key S/R, but to look for the same things I do in the lower TF’s
While there was confluence of pivot, sweetspot, buyzone and marketflow up, it came to be a loser. I think here’s the reason why I shouldn’t have entered:
Its all on the ICT video: 5-23-11: front page of thread… Still dont get how to get a strong directional bias when there is a pennant or Z-day… i was always taught that the highest prob outcome of a pennant break is the direction of the preceding trend…?? Does that add up with ICT tools??
I know you guys are caught up in trying to apply your newfound “Zday” knowledge, but all you needed was this daily chart to bank some ridiculous pips today…
and this last image is just for Alishijo, Can you tell me what time that winning OTE delineates to?
“The concept of Top Down Analysis is a method used by Professional Traders to analyze the financial markets from the long term, down to the short term perspective.”[B] ICT, Top Down Analysis.avi[/B]
“Of all the charts utilized by the market technician for forecasting and trading the financial markets, the [B]daily[/B] bar chart is by far the most popular.” [B]John J Murphy, Technical Analysis of the Financial Markets.[/B]
Apply all your tools on the higher time frames before moving down to the smaller ones, just as you said.
Thanks Ali, It is amazing how you can see things. you are very good analyst.
I did draw fibs as you mentioned and surprised to see all those relations you mentioned. woowoo. it helped me understand little but also i am confuse now, mostly because my knowledge of NY sclap is limited. I will try to learn it more. If you know any specific ICT video or post please let me know. I will also try to find stuff about NY sclap.
Yes that is my mistake to call this trade NY open. Actually you are right it is LC since I entered at 10:05 AM EST.
 Good trade management, buddy!


