XLI is an exchange traded fund (ETF) that tracks performance of the U.S industrial sector. In this blog, we look at an Elliott Wave analysis of the recent short term.
Below, we have an Elliott Wave 1 hourly chart from 4/21/2021, wherein the ETF peaked at red wave 3 area. As per Elliot Wave theory, the third wave of an impulse sequence has to be an impulse wave itself. Hence up from the black wave ((ii)), we see five waves in ((iii)), a pullback lower in ((iv)), and a final push up in ((v)). This completed red wave 3. However, the sequence up would have started at the beginning of black wave ((i)) which does not appear in the charts below.
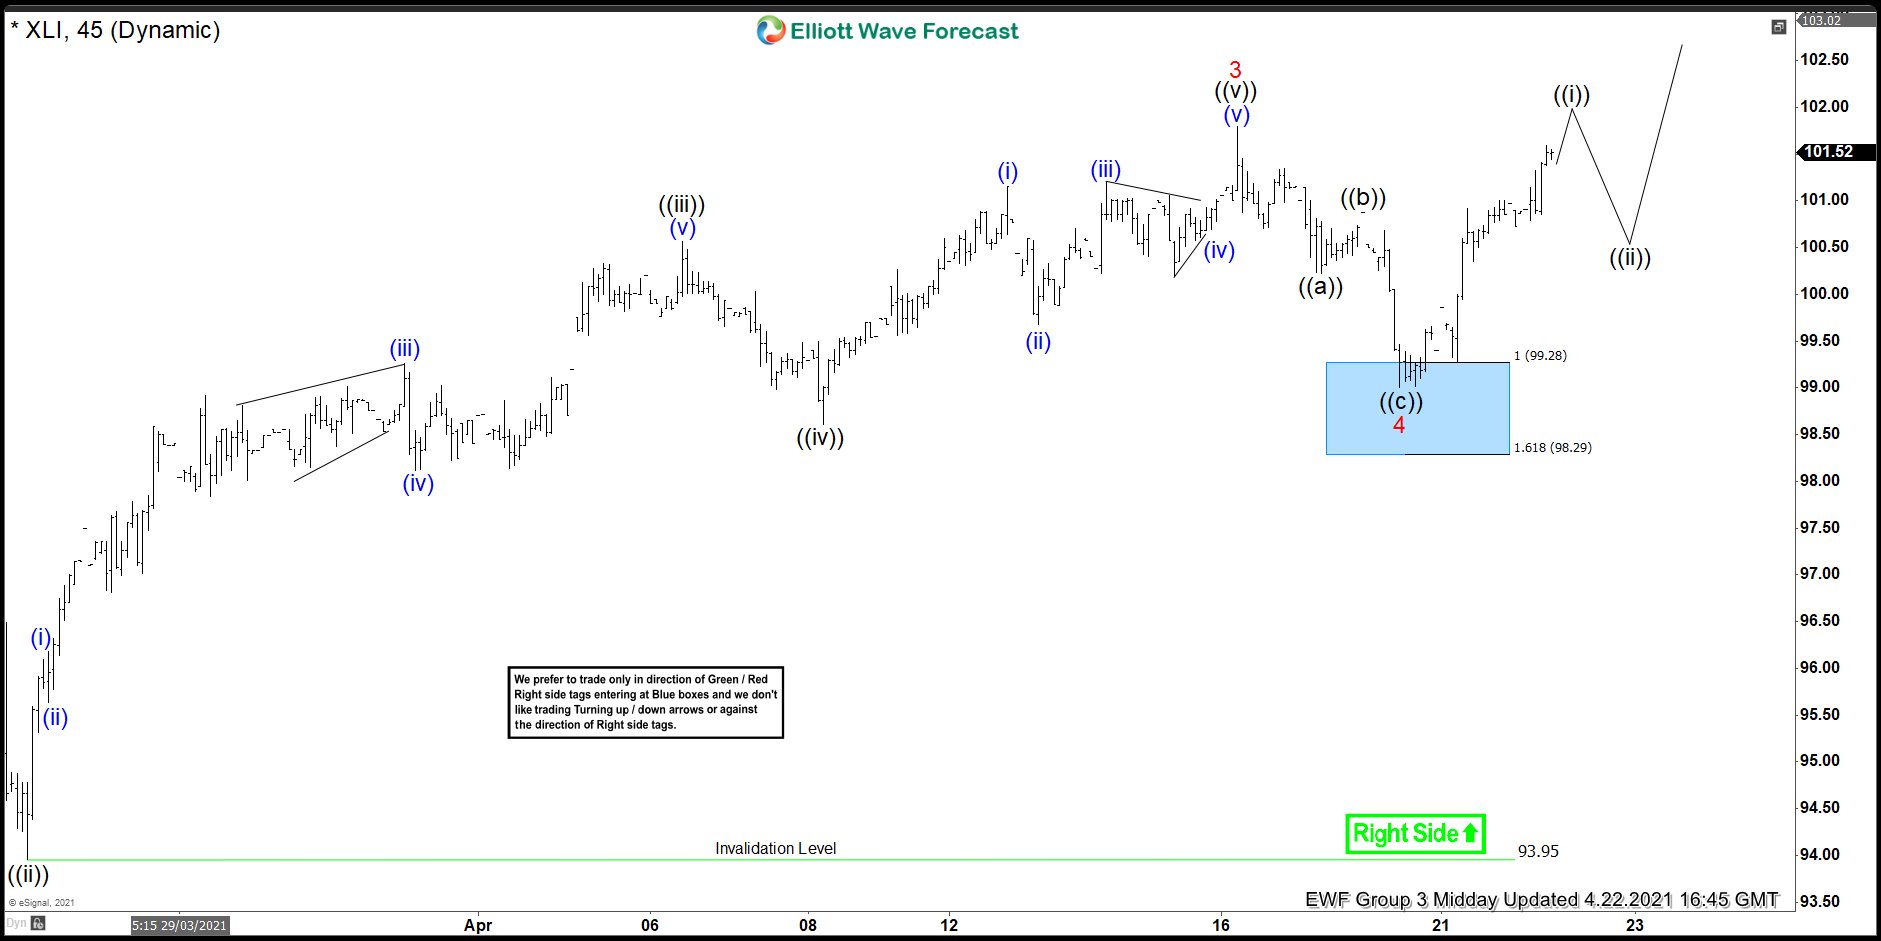
The ETF then pulled back lower into the blue box. We see black waves ((a)) and ((b)) completed in 4. We expected wave (©) lower into the blue box to complete the correction. The right side is upside against black wave ((ii)) lows at 93.95. And therefore we bought the ETF at the blue box.
Elliott Wave 1 hour Chart 4/21/2021 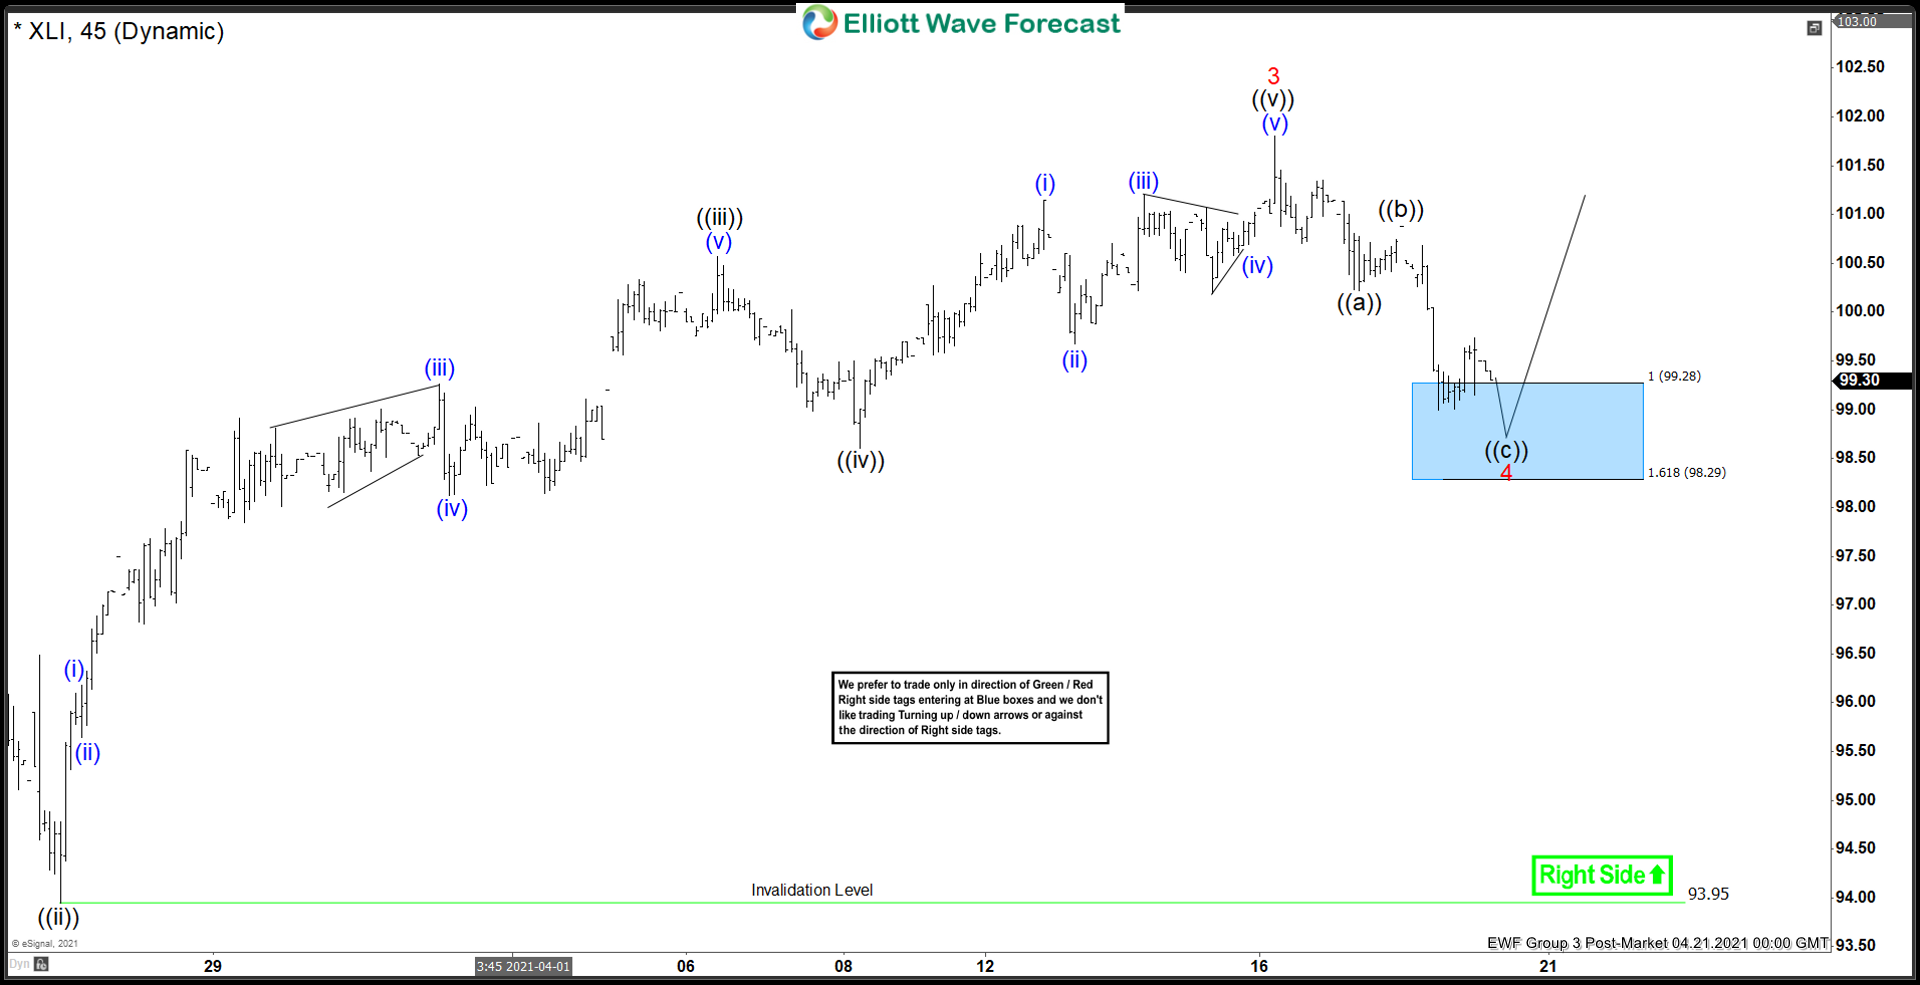
Slightly contrary to our expectation for XLI to push lower for (©), it reacted higher without breaking the previous low. However, this does not change our view. The ETF reached the blue box nonetheless. Indeed, it reacted higher after reaching the blue box as shown in the 1 hour chart from 4/22/2021 below. Up from the wave 4 lows in the blue box, we expected the ETF to complete black wave ((i)) of red wave 5. As at 4/22/2021, our long positions from the blue box is already running risk free. We expect to see more upside in the ETF in the next sessions as US industrial sector recovery continues.
Elliott Wave 1 hour Chart 4/22/2021