The “extreme” candle is a larger down candle that penetrates the lower BB? I’m assuming that it must penetrate the BB. If the price does not trade higher than the modified cbl entry line…we have no entry, but would continue to follow the downward price action looking for another cbl signal?
Yes. 
If we get a lower candle still, we operate on the lowest candle, just like in the original CBL.
It can happen sometimes that you get a premature entry with this modified version, but no real damage is done in such a case.
if their body are equals? should we enter?
First entry marked but wasn’t triggered (2 candle method). Second entry (1 candle method) was triggered and has now hit TP1. Am I right on this Tymen? Can the extreme candle be an up or down candle?
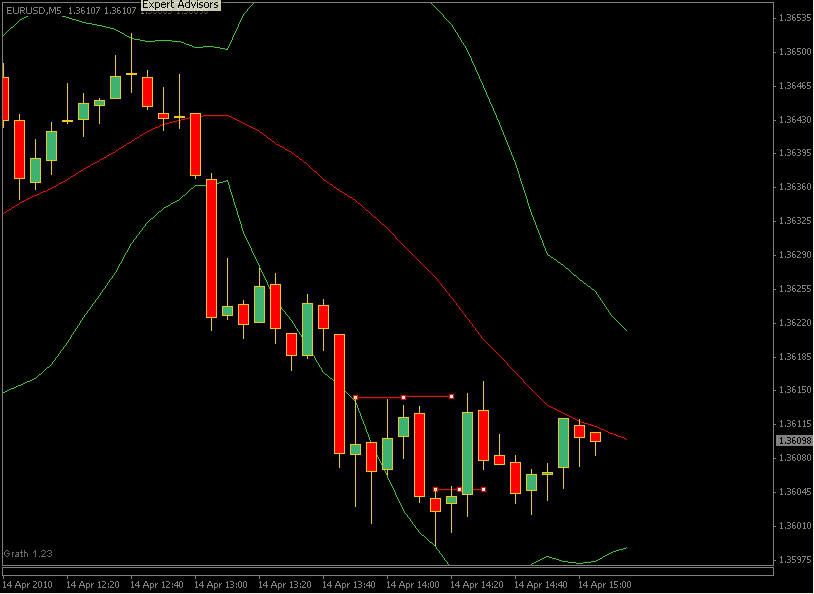
TP 2 now hit.
Hi Tymen
You showed us the example on a 20min chart GTF. How about keeping the original system with the 3 candles CBL but switch the chart to 5minutes?
Yes, we are 1 candle short since M5 goes 4 times into M20 but many people use M15 charts (MT4), therefore we would get the shorter entry without modifying the original system. Since we looked first on the M20/M15 first for the BB we would have made up our mind already if we want to enter or not. Now we switch to M5, use the 3 CBL approach and enter.
Once entered just switch back to M20/M15 and exit on the BB.
I just see PTB posted the M5 already but he did not use the M15 first.
Lets now look at some schematic charts showing the 4 price action types.
Note - the modified CBL is not the subject of these charts.
These charts are to get you familiar with the trade types with the 4 price actions.
Here we go >>>

All 4 price action types are shown in this chart.
In each case, the TP1 was set at the mid BB.
Entry 1 (OM - green), goes only as far as the mid BB.
We get TP1.
TP2 is hoped for (  ) but the price action retraces back to point 2. (RO - red).
Entry 2 (OM - green) does exactly the same thing. (TP1 profit).
After that the price action (RO - red) carries on like a two bob watch and finally rests at point 3.
Entry 3 (OO - pink), manages to pass the mid BB and close at point 4.
We get TP1 and TP2. 
Entry 4, a short entry, (OO - pink), does exactly the same thing. (TP1 + TP2).
Entry 5 is another OM - green. (TP1 only).
Entry 6 is a nice OO - pink trade. (TP1 + TP2)
Entry 7 is another OM - green. (TP1 only).
The untradeable RO - red retraces back to point 8.
Entry 8 is a OBB - blue trade.
The price action goes on to walk the lower BB band.
We get TP1 and TP2.
Here we have 8 trades in all.
They are carefully managed according to our DNA rules.
We have 4 complete TP1 + TP2 profits.
We have 4 TP1 profits only.
We have ZERO losses!!
Nice chart and well drawn PTB!!
(though I do not like black charts) 
[B]Everything is correct!![/B]
The extreme candle can be any candle, even a doji.
Glad to see that TP2 was hit as well.
I believe this method works well.
After we iron out some of the wrinkles, we can see about improving the risk/reward by extending the trades.
I leave that for a judgement call to you.
Such a situation is rare!!
2 candles is always preferable because it keeps you clear of potential price retracements.
But if 2 candles here puts you too close to the mid BB, then one candle may be better.
There are no hard and fast rules here - you could use 1.5 candles!! 
But it goes below the entry point before going up again,isn"t that a bad trade?And all my trades are looking like these,i got no wins yet.They all hit the entry and go back.
The extreme candle can be any candle, even a doji.
So the extreme candle is the last candle on the chart and the one on which we are trying to make a determination on?
I can see your strategy in using the CBL in the 5 minute chart to effect a better entry than say, the 20 minute chart.
The problem with this is that you may get an unwanted entry in the 5 minute chart.
The 5 minute chart says enter and shows where to enter, but the 15/20 minute chart shows no such entry and price retrace instead.
In such cases you make one whopping great loss!! :eek: :eek:
If too frequent, you end up with a very poor win/loss ratio. 
This danger also exist with the naked traders using SR lines.
Going down to the short timeframes means they could suddenly find their entries being short circuited!!
I think it is better to keep everything on one chart if at all possible.
And it is possible with this [B]Bollinger DNA method.[/B]
However, feel free to go it alone and develop your approach if you wish.
I will wish you well all the way!!
But you have only just joined the forum and this thread.
Without charts to back it up, I have no idea what you are doing.
Being new here, you may well be making all kinds of mistakes.
Here is instruction on how to post charts.
If you use this, you can explain your situation better…
http://forums.babypips.com/newbie-island/30564-how-post-charts-forum-upgraded.html
Correct!!
Assuming that the last candle is the extreme candle.
I sense a certain amount of silence here and possibly a great deal of bewilderment. :eek:
That is OK.
[B]I did warn that this stuff is not for beginner traders[/B]. 
However, once you are well aquainted with this method, you will love the win/loss ratio.
It does take time to get accustomed to it.
If, on the other hand, if readers now leave this thread in droves because they did not get what they were looking for, that is all the better for me!!
[B]The less traders that operate this highly reliable method, the better!![/B]
This chart can be used as example…Price hits the entry point,go up and retraces back to below the entry point before going back up.During the period price is below the entry point the trade looks bad.Any reason to stay in it?
its long entry,
you have to place SL order at the bottom of the red candle and your take profit at the middle band
The BB is a great tool and that’s the reason to trade the BB almost naked.
There are just two more lines, Daily S/R. Always M5, that’s it.
Sorry that I can’t mention who actually should get credit for it but I respect tymen’s sensitivity on this matter.

Not bewildered here, just absorbing and hoping that the end is near so we can start to trade this beast It’s taking shape very nicely as far as i’m concerned.
I have one question about the 8 trade examples you put together. On Trade 8, the OBB trade, you have let the trade ride the outer BB for what will obviously be a great R:R ratio. I presume that you let this run because the middle BB (the MA) turned in favour of our trade direction, giving us fair warning that a new trend had formed? If so, is the exit on the first bar that closes fully clean of the BB?
Apologies if you were going to come on to this and i’ve jumped the gun
[I]In the first case, we use two candles if the [U]previous candle body[/U] is [U]smaller [/U]than the extreme candle.
In the second case, we use only one candle if the [U]previous candle body[/U] is [U]larger [/U]than the extreme candle.[/I]
[B]Does the extreme candle include that candles wicks, or just its body?[/B]