[B]Advanced Trend Line Trading with SSD[/B]
[B]Currency cross:[/B] GBP/USD (tested) others may be applicable.
[B]Time frame:[/B] 4 hour.
[B]Lot size:[/B] Suggested 0.5% - 1% of account balance.
[B]Indicators: [/B]
Hand drawn trend lines.
SSD (slow stochastic) set to 10:4:2
[B]Indicators (optional):[/B]
Bollinger band set to 2 standard deviations (20 period).
Linear Regression line (5 period).
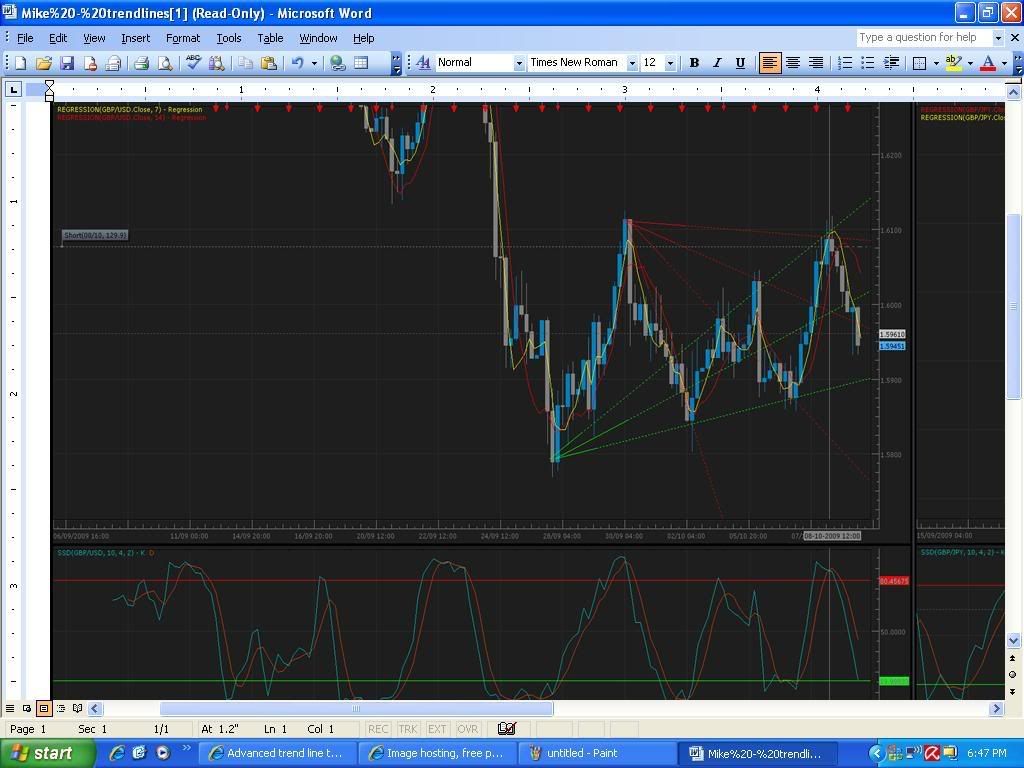
[B]Please refer to attached chart when reading the set up.[/B]
I have loaded the chart into Microsoft Word so that it can be expanded up to 500% for an in detail examination of the placing of trend lines.
[B]Preamble:[/B]
Most professional traders prefer the 4 hour time chart and up. There is good reason for this. It is a truism that the longer time charts give a clearer indication of market sentiment and of course ultimately, the real direction of price action.
Most new traders prefer the 5 minute and 15 minute charts and they have merit. However, before dismissing the longer time charts I would urge you to at least give this method a try in demo. You may be surprised with the amount of pips you can actually make over a typical week. This week by way of example I have placed only three trades, 1) 06/10 = 130 pips. 2) 07/10 = 180 pips. 3) 08/10 = 174 pips. Total for the week = 484 pips. In all three cases I exited the trade at what I considered to be a prudent time. However, in two of the three trades more pips could have been made had I stayed in longer.
[B]Set up:[/B]
Bring up a 4 hour chart of GBP/USD. Underneath the 4 hour chart bring up a box with a SSD (slow stochastic) with settings of 10:4:2. If the 80% and 20% lines are not already drawn in put them in.
Draw down trend lines from the highest high of recent price action down to intersect the solid tops of more recent highs as the chart unfolds. Draw up trend lines from the lowest low of recent price action up to intersect the solid candle bottoms of more recent lows as the chart unfolds (see attached chart for recent illustration).
[B]Entering the trade:[/B]
It’s important to remember we are using a 4 hour chart, so there is no rush to make a judgment as to a precise time of entry.
-
Look to the trend lines. Has price hit a cross of a lower/ upper trend line? If so, proceed to step 2.
-
Look to the SSD is it over the 80% or under the 20%? If yes, look for a faster line cross of the slower line. This usually signals a reversal of price is immanent if not already underway.
-
If 1 & 2 have been met either enter the trade or look for a secondary confirmation before entering the trade. The classic reversal pattern on the four hour chart is two 4 hour candles usually with one or two wicks. First the 4 hour candle touches or brakes the lower/ upper trend line cross and wicks. Second 4 hour candle may also wick but is the price reversal candle (see attached chart). An additional indication of over bought/ sold can include price near or have broken an upper/ lower 2 std dev Bollinger band.
[B]Stop loss:[/B]
A stop loss should be set just above the highest/ lowest candle wick (if present) of the two 4 hour candles. I prefer to manually move my stop down as the trade progresses leaving enough room for price fluctuations whilst following the overall predicted direction. But a trailing stop can be used if preferred (suggested setting: 50 pips).
[B]Exiting the trade:[/B]
Follow price action candles up/ down and pay close attention to each cross of a trend line. But particular attention to an upper/ lower trend line cross. These are the likely reversal points, particularly the latter.
[B]Optional:[/B]
On the 4 hour chart place a regression line with a 5 setting. This serves no other purpose other than to confirm the SSD indicator (always a good idea to have a back up indicator for confirmation).
On the 4 hour chart place a 2 std dev Bollinger band (20 period). Again this is a back up indicator of SSD confirming over bought/ sold.
[B]Posted chart:[/B]
The vertical line indicates where I entered my last trade of this week. I exited the trade at the lower green trend line at 174 pips. However, price continued down another 50 pips.
I will endeavor to post regular chart up dates with added trend lines as they become clear. I may even suggest a trade or two.


