Go Back   BabyPips.com Forex Forum > "The Holy Grails" > Free Forex Trading Systems


Free Forex Trading Systems Got the "Holy Grail" system? Want to share it for free and become everyone's hero? This is the place to do it. (No advertisers please!) Also, follow along as our very own Pip Surfer posts daily updates from his Cowabunga System in the Pip My System Forex Blog.

Reply
 
LinkBack Thread Tools Display Modes
  #1 (permalink)  
Old 10-10-2009, 09:16 AM
R Carter's Avatar
FX-Men Honorary Member
 

Join Date: May 2009
Location: London, UK
Posts: 1,286
Default Advanced trend line trading with SSD

Advanced Trend Line Trading with SSD


Currency cross: GBP/USD (tested) others may be applicable.

Time frame: 4 hour.

Lot size: Suggested 0.5% - 1% of account balance.

Indicators:
Hand drawn trend lines.
SSD (slow stochastic) set to 10:4:2

Indicators (optional):
Bollinger band set to 2 standard deviations (20 period).
Linear Regression line (5 period).

Please refer to attached chart when reading the set up.
I have loaded the chart into Microsoft Word so that it can be expanded up to 500% for an in detail examination of the placing of trend lines.

Preamble:
Most professional traders prefer the 4 hour time chart and up. There is good reason for this. It is a truism that the longer time charts give a clearer indication of market sentiment and of course ultimately, the real direction of price action.

Most new traders prefer the 5 minute and 15 minute charts and they have merit. However, before dismissing the longer time charts I would urge you to at least give this method a try in demo. You may be surprised with the amount of pips you can actually make over a typical week. This week by way of example I have placed only three trades, 1) 06/10 = 130 pips. 2) 07/10 = 180 pips. 3) 08/10 = 174 pips. Total for the week = 484 pips. In all three cases I exited the trade at what I considered to be a prudent time. However, in two of the three trades more pips could have been made had I stayed in longer.

Set up:
Bring up a 4 hour chart of GBP/USD. Underneath the 4 hour chart bring up a box with a SSD (slow stochastic) with settings of 10:4:2. If the 80% and 20% lines are not already drawn in put them in.

Draw down trend lines from the highest high of recent price action down to intersect the solid tops of more recent highs as the chart unfolds. Draw up trend lines from the lowest low of recent price action up to intersect the solid candle bottoms of more recent lows as the chart unfolds (see attached chart for recent illustration).

Entering the trade:
It's important to remember we are using a 4 hour chart, so there is no rush to make a judgment as to a precise time of entry.

1) Look to the trend lines. Has price hit a cross of a lower/ upper trend line? If so, proceed to step 2.

2) Look to the SSD is it over the 80% or under the 20%? If yes, look for a faster line cross of the slower line. This usually signals a reversal of price is immanent if not already underway.

3) If 1 & 2 have been met either enter the trade or look for a secondary confirmation before entering the trade. The classic reversal pattern on the four hour chart is two 4 hour candles usually with one or two wicks. First the 4 hour candle touches or brakes the lower/ upper trend line cross and wicks. Second 4 hour candle may also wick but is the price reversal candle (see attached chart). An additional indication of over bought/ sold can include price near or have broken an upper/ lower 2 std dev Bollinger band.

Stop loss:
A stop loss should be set just above the highest/ lowest candle wick (if present) of the two 4 hour candles. I prefer to manually move my stop down as the trade progresses leaving enough room for price fluctuations whilst following the overall predicted direction. But a trailing stop can be used if preferred (suggested setting: 50 pips).

Exiting the trade:
Follow price action candles up/ down and pay close attention to each cross of a trend line. But particular attention to an upper/ lower trend line cross. These are the likely reversal points, particularly the latter.

Optional:
On the 4 hour chart place a regression line with a 5 setting. This serves no other purpose other than to confirm the SSD indicator (always a good idea to have a back up indicator for confirmation).

On the 4 hour chart place a 2 std dev Bollinger band (20 period). Again this is a back up indicator of SSD confirming over bought/ sold.
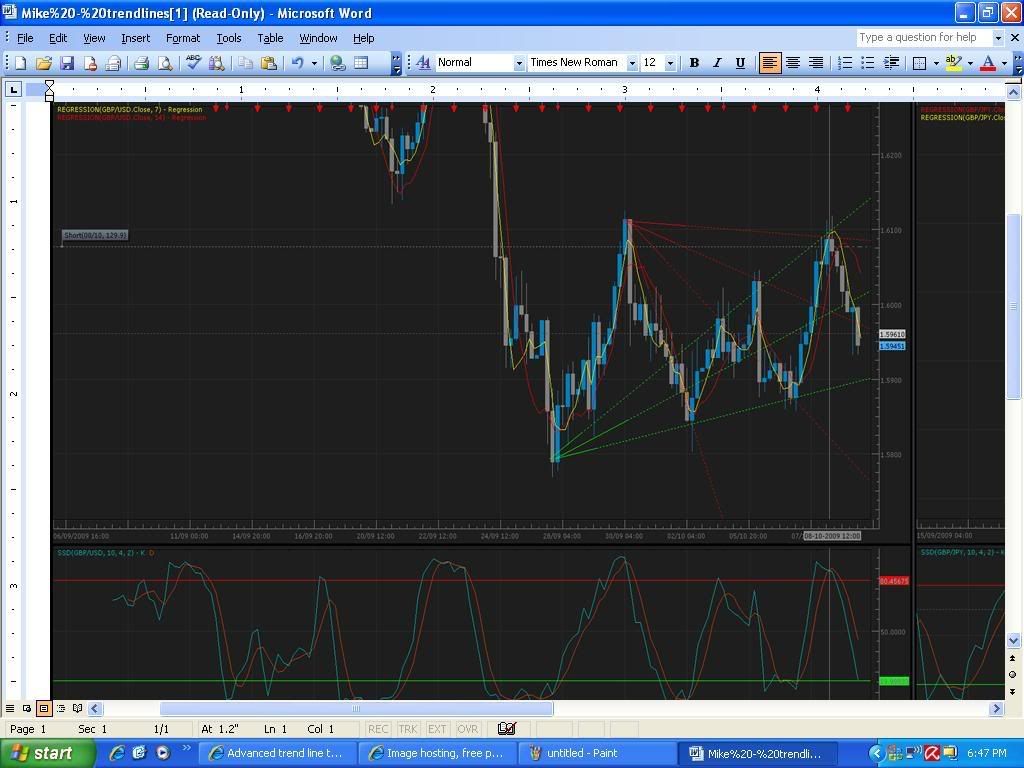


Posted chart:
The vertical line indicates where I entered my last trade of this week. I exited the trade at the lower green trend line at 174 pips. However, price continued down another 50 pips.

I will endeavor to post regular chart up dates with added trend lines as they become clear. I may even suggest a trade or two.
Attached Files
File Type: doc Mike - trendlines.doc (199.5 KB, 342 views)
Reply With Quote
  #2 (permalink)  
Old 10-10-2009, 10:10 AM
d-pip's Avatar
Master Contributor and Member
 

Join Date: Jan 2009
Location: CT USA
Posts: 350
Default

Looks great, especially if you’re trying to grab some pips and... sleep. And currently I’m suffering from a shortage of both.

So, this afternoon I’m going to start drawing my trend lines... going to try it on GBP/USD, EUR/USD, GBP/JPY and AUD/USD.

thanks!
Reply With Quote
  #3 (permalink)  
Old 10-10-2009, 11:43 AM
Superior Master Contributor and Member
 

Join Date: Aug 2009
Location: Ontario, Canada
Posts: 567
Default

Looks interesting. Looking forward to see how your forward testing goes. I trade a similar system based on the daily charts using MA crossovers as indicators.

I'll experiment with the use of trendlines also. How do you use the trendlines in your system? Do you trade breakouts of the trendlines in cooperation with the other indicators for confirmation (if I understood the explanation correctly)?
Reply With Quote
  #4 (permalink)  
Old 10-10-2009, 12:19 PM
SanMiguel's Avatar
FX-Men Honorary Member
 

Join Date: Mar 2009
Location: UK
Posts: 1,305
Default

Nice.
Are you always drawing the trendlines based on candle bodies?

I'm not sure I understand the highlighted red DT (down trendline) as it completely intersects PA from the last swing low. Are you looking for any trendline in the region? I guess a lot of people simply look at DT as connecting through lower highs and UT connecting through higher lows.
Channels is another thing...
Attached Images
File Type: jpg a.jpg (106.4 KB, 147 views)

Last edited by SanMiguel; 10-10-2009 at 12:23 PM.
Reply With Quote
  #5 (permalink)  
Old 10-10-2009, 01:28 PM
d-pip's Avatar
Master Contributor and Member
 

Join Date: Jan 2009
Location: CT USA
Posts: 350
Default

I’m going to start simple and just draw the trend lines that will guide and confirm whether I should be long or short for the next move. Looks like you might be drawing the trend lines to project TP too, yes?

I’ve attached GBP

Below the Green & yellow trend lines = breakout to the low side, short the $hit out of it

If it bounces off the green & yellow trend lines, breaks pink line, load up and long

am I getting close?

Still trying to draw trend for EUR/USD, but... “spastic” is that the right word?


Sorry, after spending the last 30+ years working in the photo & graphic-arts biz, you would think my charts wouldn’t look so crappy & fuzzy! LOL

i’ve got to work on this!


Attached Images
File Type: jpg gpb 10 10 1.jpg (41.6 KB, 675 views)

Last edited by d-pip; 10-10-2009 at 02:38 PM.
Reply With Quote
  #6 (permalink)  
Old 10-10-2009, 01:30 PM
TalonD's Avatar
FX-Men Honorary Member
 

Join Date: Apr 2009
Posts: 1,805
Default

Quote:
Originally Posted by SanMiguel View Post
Nice.
Are you always drawing the trendlines based on candle bodies?

I'm not sure I understand the highlighted red DT (down trendline) as it completely intersects PA from the last swing low. Are you looking for any trendline in the region? I guess a lot of people simply look at DT as connecting through lower highs and UT connecting through higher lows.
Channels is another thing...
that bottom most red line doesn't seem to connect to the solid tops of more recent highs, Same for the topmost green line, it doesn't appear to connect to the solid bottoms of more recent lows. Perhaps these were connecting earlier when PA was at that point and later PA moved on past those points ?


gee these charts look familiar
Reply With Quote
  #7 (permalink)  
Old 10-10-2009, 05:57 PM
R Carter's Avatar
FX-Men Honorary Member
 

Join Date: May 2009
Location: London, UK
Posts: 1,286
Default

I only trade GU and thus can only refer to GU in this strategy with any conviction. I have a three monitor set up and print screen prints all screens. Please only refer to GU. I brought up GBP/JPY to see if there was any correlation on any other currency crosses (incomplete work in progress).
Reply With Quote
  #8 (permalink)  
Old 10-10-2009, 06:15 PM
R Carter's Avatar
FX-Men Honorary Member
 

Join Date: May 2009
Location: London, UK
Posts: 1,286
Default

When price action exceeds the trend lines upper or lower there is a way to place additional trend lines. Price did indeed go below the GU lower green line. But I was looking to take profits at the green line as was near to Friday London close.

I will post an updated chart Sunday when trading opens. I did not want to overlay an additional set of trend lines on the chart already posted. As this may have clouded clear price action in accordance with the lines already drawn. Which was intended to illustrate the strategy.

A trade is initiated when the stochastic faster line crosses the slower above 80% or below 20% in conjunction with price action at a down/ up trend line cross in the appropriate direction.
Reply With Quote
  #9 (permalink)  
Old 10-10-2009, 06:49 PM
R Carter's Avatar
FX-Men Honorary Member
 

Join Date: May 2009
Location: London, UK
Posts: 1,286
Default

Quote:
Originally Posted by soul786 View Post
How do you use the trendlines in your system? Do you trade breakouts of the trendlines in cooperation with the other indicators for confirmation (if I understood the explanation correctly)?
Its all in the strat as posted.

Trade price action either way. Entry and exit at trend line crosses and stochastic above 80% or below 20%. Secondary indicators for additional confirmation. Again all in strat.

Last edited by R Carter; 10-10-2009 at 06:58 PM.
Reply With Quote
  #10 (permalink)  
Old 10-10-2009, 07:06 PM
R Carter's Avatar
FX-Men Honorary Member
 

Join Date: May 2009
Location: London, UK
Posts: 1,286
Default

Mike (TalonD) has suggested there is a strong correlation to a Fib fan and the trend lines I have drawn in to my GU chart. My charting package doesn't have Fib fan but I if this is the case so much the better. If you have it I would suggest putting them up and see?
Reply With Quote
Reply


Thread Tools
Display Modes

Posting Rules
You may not post new threads
You may not post replies
You may not post attachments
You may not edit your posts

BB code is On
Smilies are On
[IMG] code is On
HTML code is Off
Trackbacks are On
Pingbacks are On
Refbacks are On


All times are GMT -4. The time now is 07:56 PM.
Content Relevant URLs by vBSEO 3.3.1
"Action may not always bring happiness; but there is no happiness without action."
Benjamin Disraeli
Feedback Form