First, sorry about the huge post…
I’ve been around on this forum for several years now. During these years I have spent on average several hours every evening in front of the computer reading, testing and thinking about forex trading. I’ve made the usual journey complete with system jumping, revenge trading, bringing my account to its knees on my first live attempt, going down dead ends, looking at EAs, arguing with forum trolls, etc. You get the idea.
Thankfully, since I’m only slightly more than half stupid, I’ve actually managed to learn a thing or two along the way. I’ve seen many people start threads here and elsewhere to teach or develop their systems. I’ve read many of them, some are good but most face the Darwinian extinction sooner rather than later.
I’ve had my own little thread going for some time, a thread which has become more and more like the geological layers paleontologists and archaeologists love to excavate.
This will be my attempt at contributing something useful to the community here at Babypips. I’ve been thinking about starting a thread like this for a while, so when the good people here came up with the Trading System of the Month concept, I had no more excuses.
Let’s start off with a brief segment about how I view the forces that drive the markets and thus control how our charts look.
What is a market? The answer according to me is that a market is a place where the price of something is set through a continuous auctioning procedure. Think of your local auction - a man stands on the scene holding up a vase and says: the starting price for this beautiful vase is 5$, does anyone bid 5$?
A group of five people in the audience all want the vase and they start trying to out bid each other until one of them places a bid that the others decide is so high that if they match and raise it they will be paying more for the vase than they consider it to be worth. Thus the group has decided what the price of the vase should be given the circumstances at that time.
Now imagine what would happen if the next item is a box containing ten more vases exactly like the one they just fought over. The supply suddenly increases in such a way that there are more vases than there are people interested in buying one. Suddenly there’s no competition for the vases and the auctioneer may now even have to lower his opening price to get them sold.
This was a short description of how supply and demand work when the price of something is decided. This is also how the forex market works.
In other words, the basic principle that controls price is supply and demand, make no mistake about it. The collective emotions of the people taking part in the auction is also a determining factor for how the supply and demand will turn out. Imagine for instance what the result would have been if the five people interested in the vase had all wanted to build as large a collection of such vases as possible. Likely, all eleven vases would then have been auctioned off at the very highest prices that the five people could afford.
So, supply/demand + human psychology = current price
Above is my extreme simplification of how I view the markets. Those of you wondering why I left out words such as technical/fundamental, here’s the answer: these do impact the price, but they do so only by affecting the human psychology or the supply/demand components of the equation, not by themselves.
The lesson to be learned by this is that the only indicators of any real use would be those that indicate to us what the current supply/demand situation is and those who track the market’s collective psychology.
Spot forex is different from other markets in that there is no reliable information on trading volume to be had since there’s no central exchange that keeps track of everything. This leaves us only the price chart itself to try to glean the supply/demand situation from. For more information on how to do this I suggest looking up Sam Seiden’s videos. (I know, you can look at futures volume or tick volume etc, but that’s a discussion for some other thread)
As for how to gauge the market’s sentiment, there are many ways but the most widely used (and perhaps simplest) is without doubt the moving average. The theory is simple - if price is above the moving average then the market sentiment is obviously bullish and vice versa.
In my system I will try to gauge the supply/demand situation using the simplest approach possible. I will be looking for common bar formations, mostly two bar formations but also multiple bar formations.
To gauge market sentiment I will be using a moving average. I could have used a simple moving average, the results would not differ much. But I decided to use a moving pivot point average instead. It’s mostly a matter of personal taste, but I chose it because I believe it slightly better tracks market sentiment.
The finesse of this pivot moving average is that it takes the (highest high + lowest low) of a period of x number of bars + the most recent close and then divides by three. This makes it possible, for instance on the 4H charts, to calculate your moving average based on the highest high + the lowest low of the last five trading days + the most recent bar close. If you want, you can instead take the highest high and lowest low of just the last 24 hours, or can use the last month - your choice.
Bar formations and the pivot MA are the only things I will use. The reason I try to keep things as absolutely simple as possible is that when I’m at work I don’t have the time to sit and draw horizontal lines etc. This approach takes care of almost everything, only the discretionary parts of deciding whether to take a setup or not and how to manage it is left to us.
I find it attractive not having to spend hours every night drawing and reviewing lines/zones on all the pairs I watch.
What do we really need to know in order to be able to trade profitably? The answer is as simple as it is obvious - we only really need to know if price is more likely to go up or down. Sounds ridiculous doesn’t it? But it’s true if you think about it. We don’t need to know anything about fundamentals or indicators or wedges, head and shoulders or anything else.
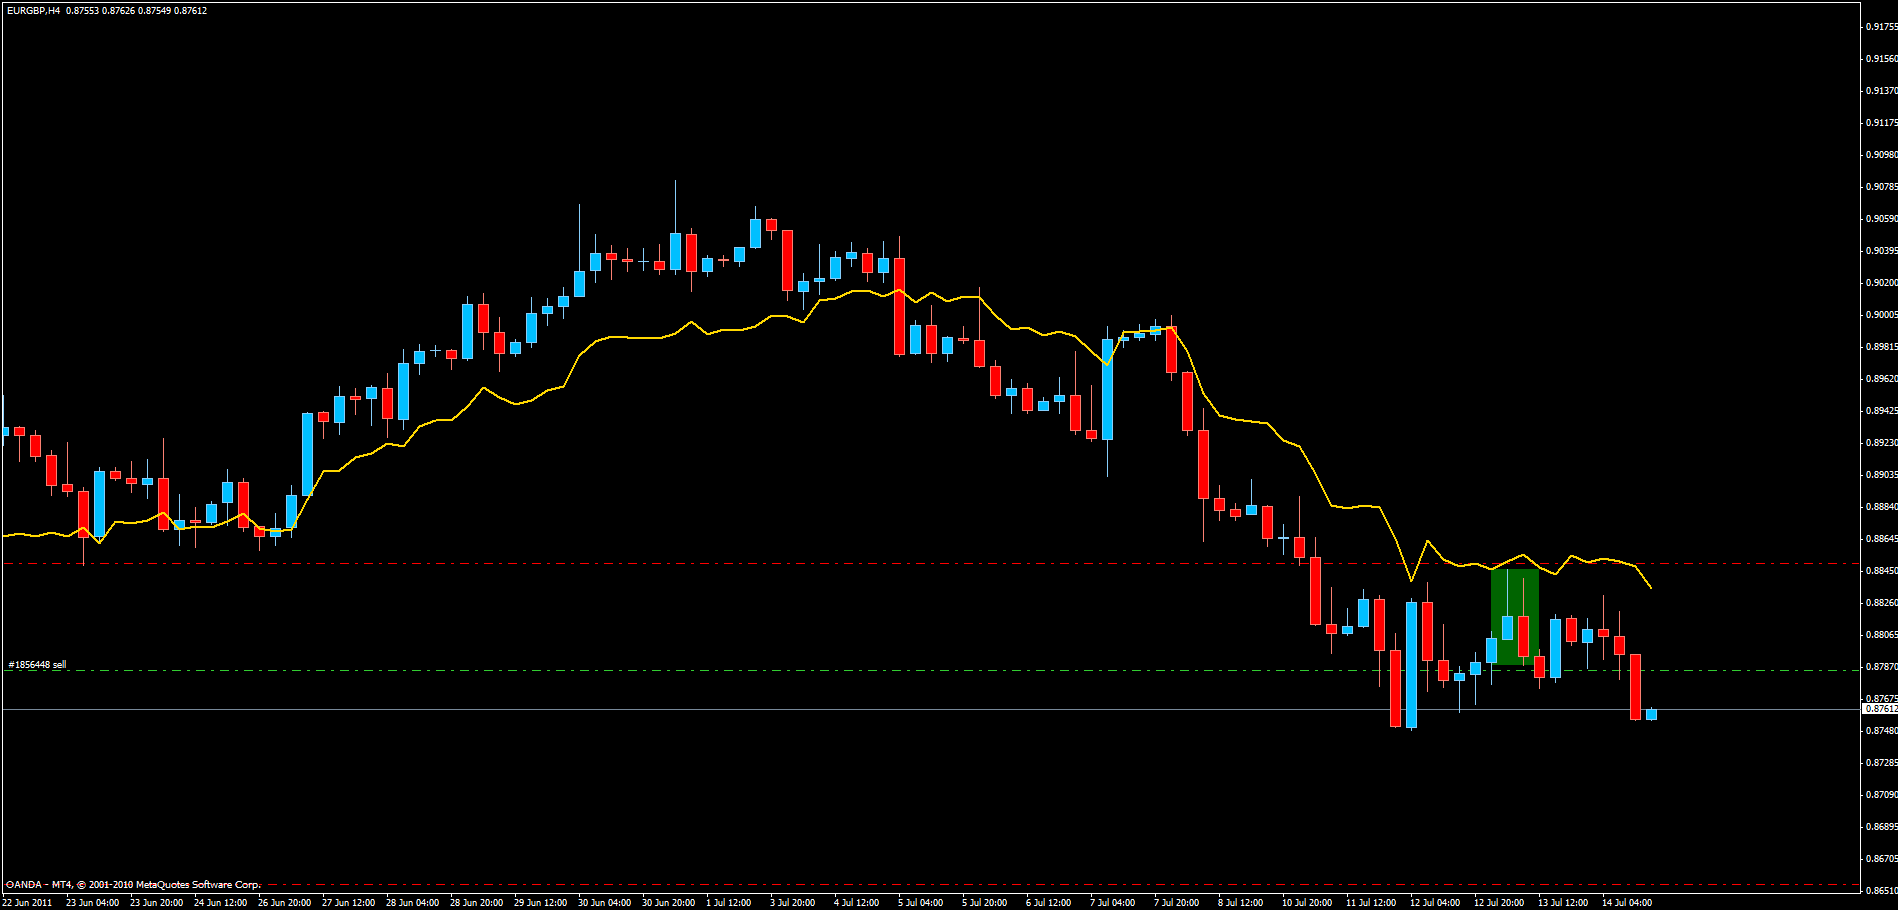
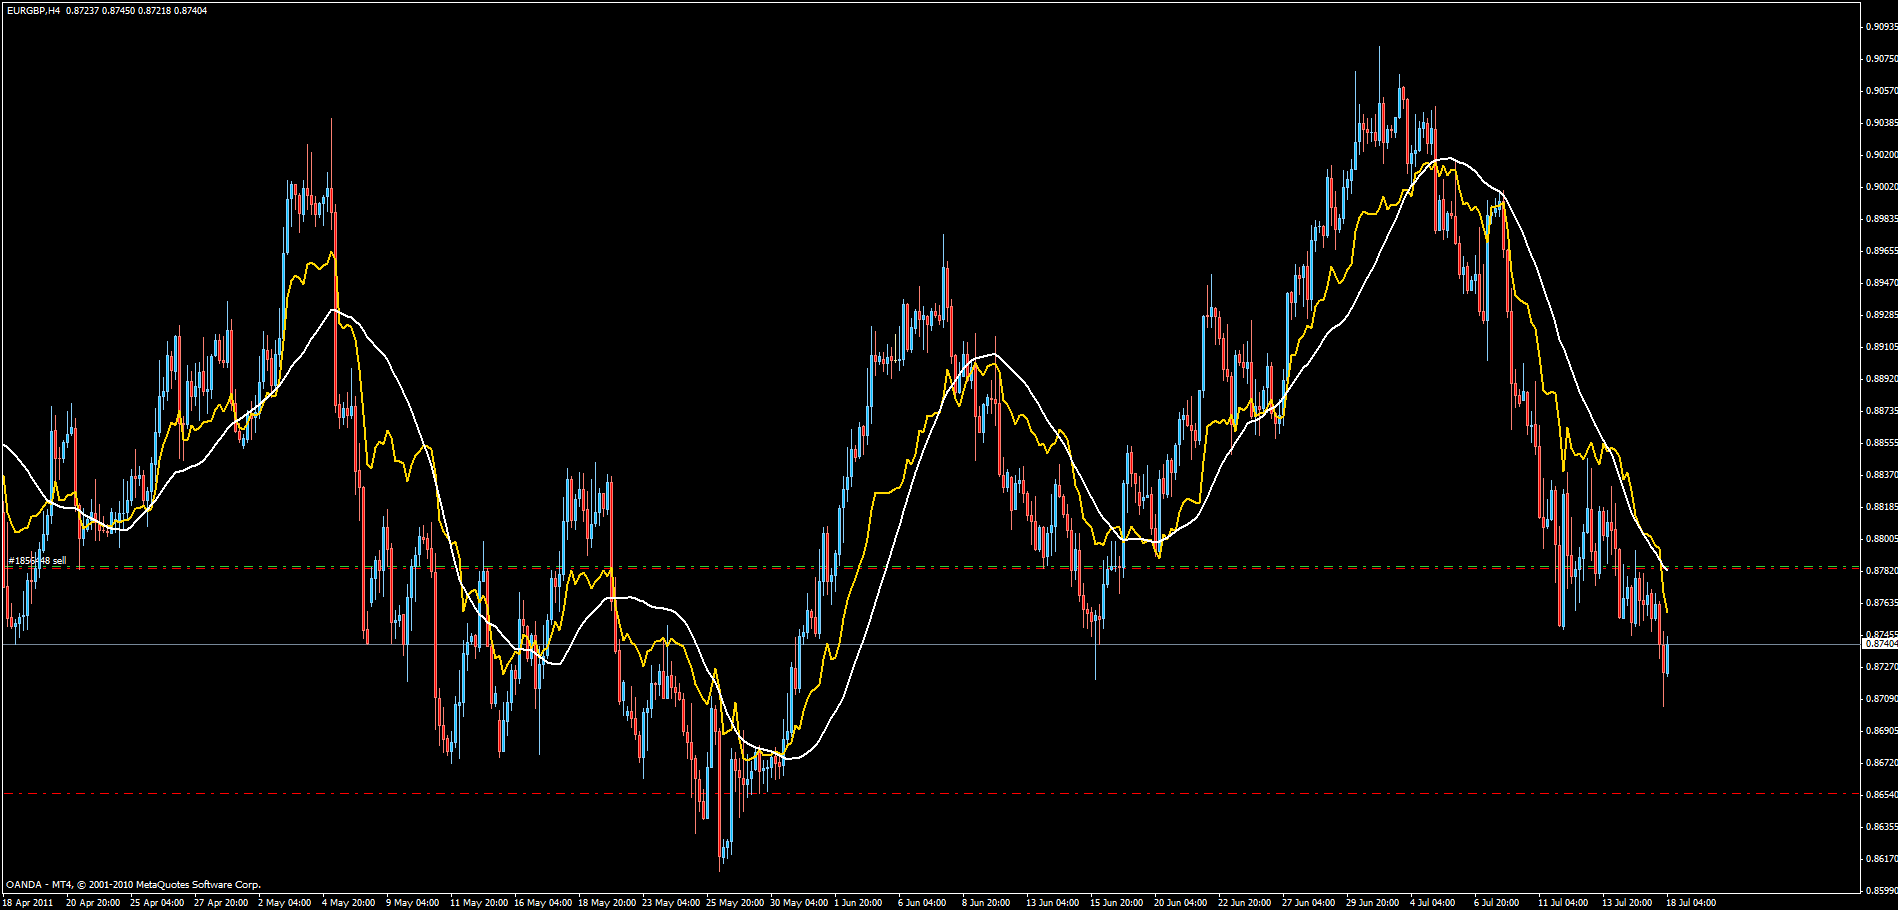
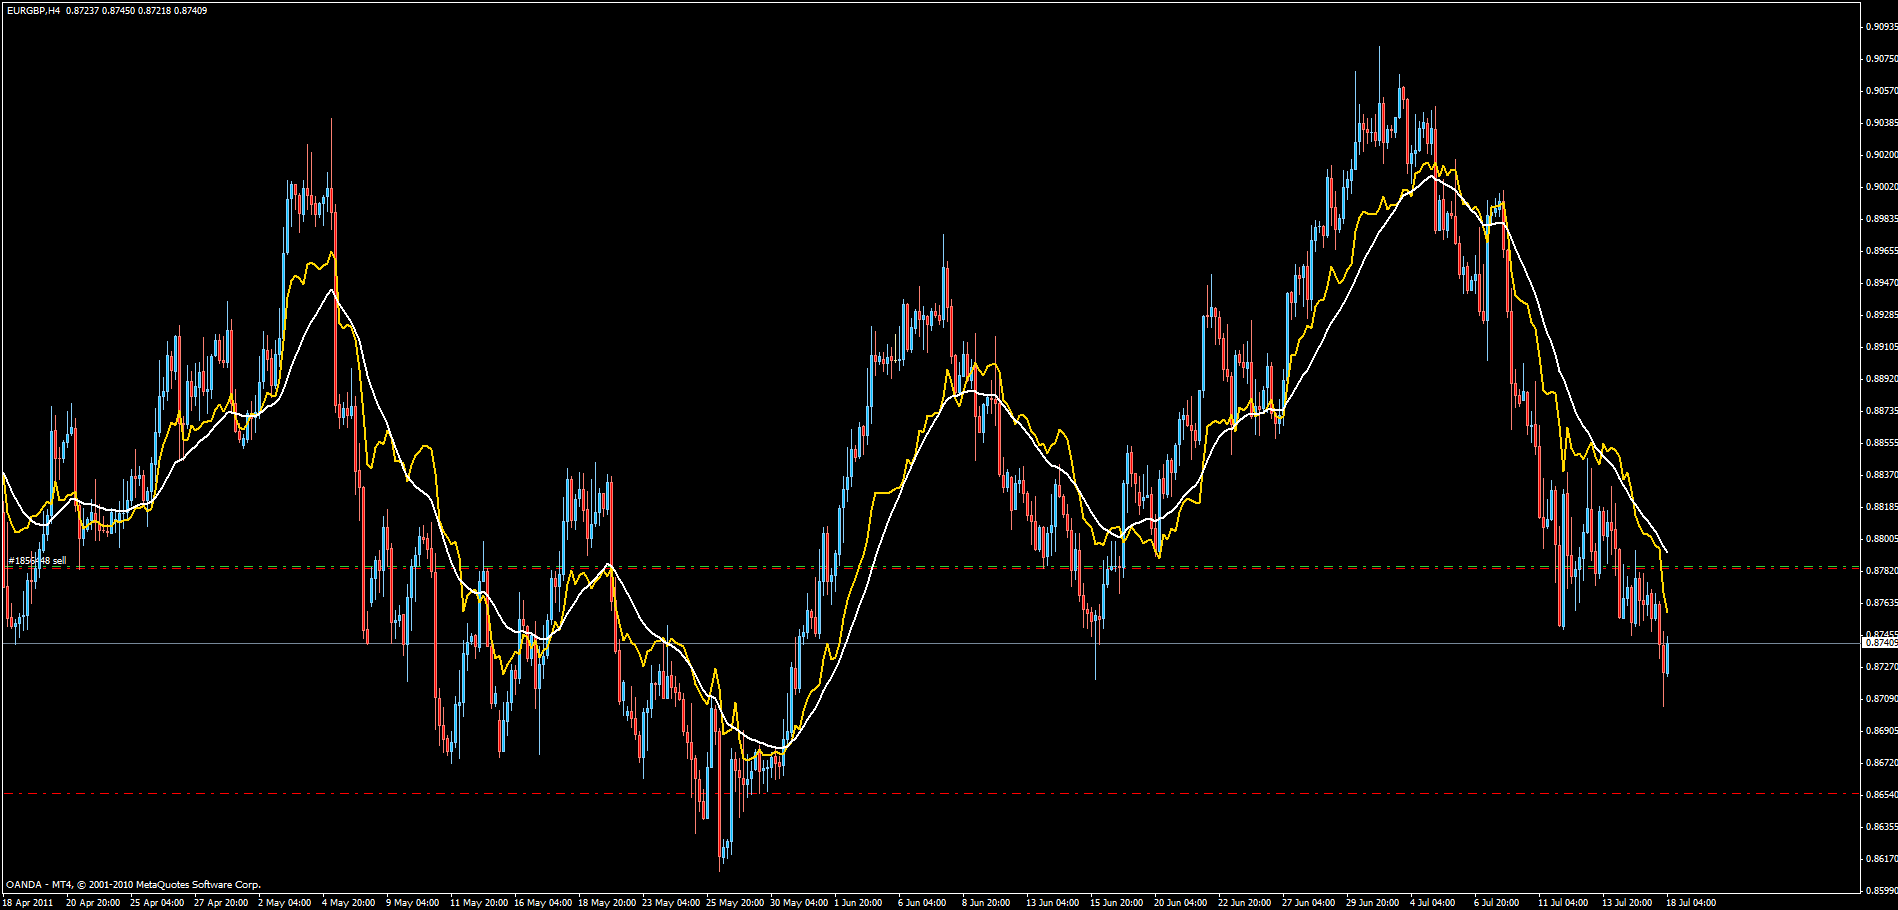
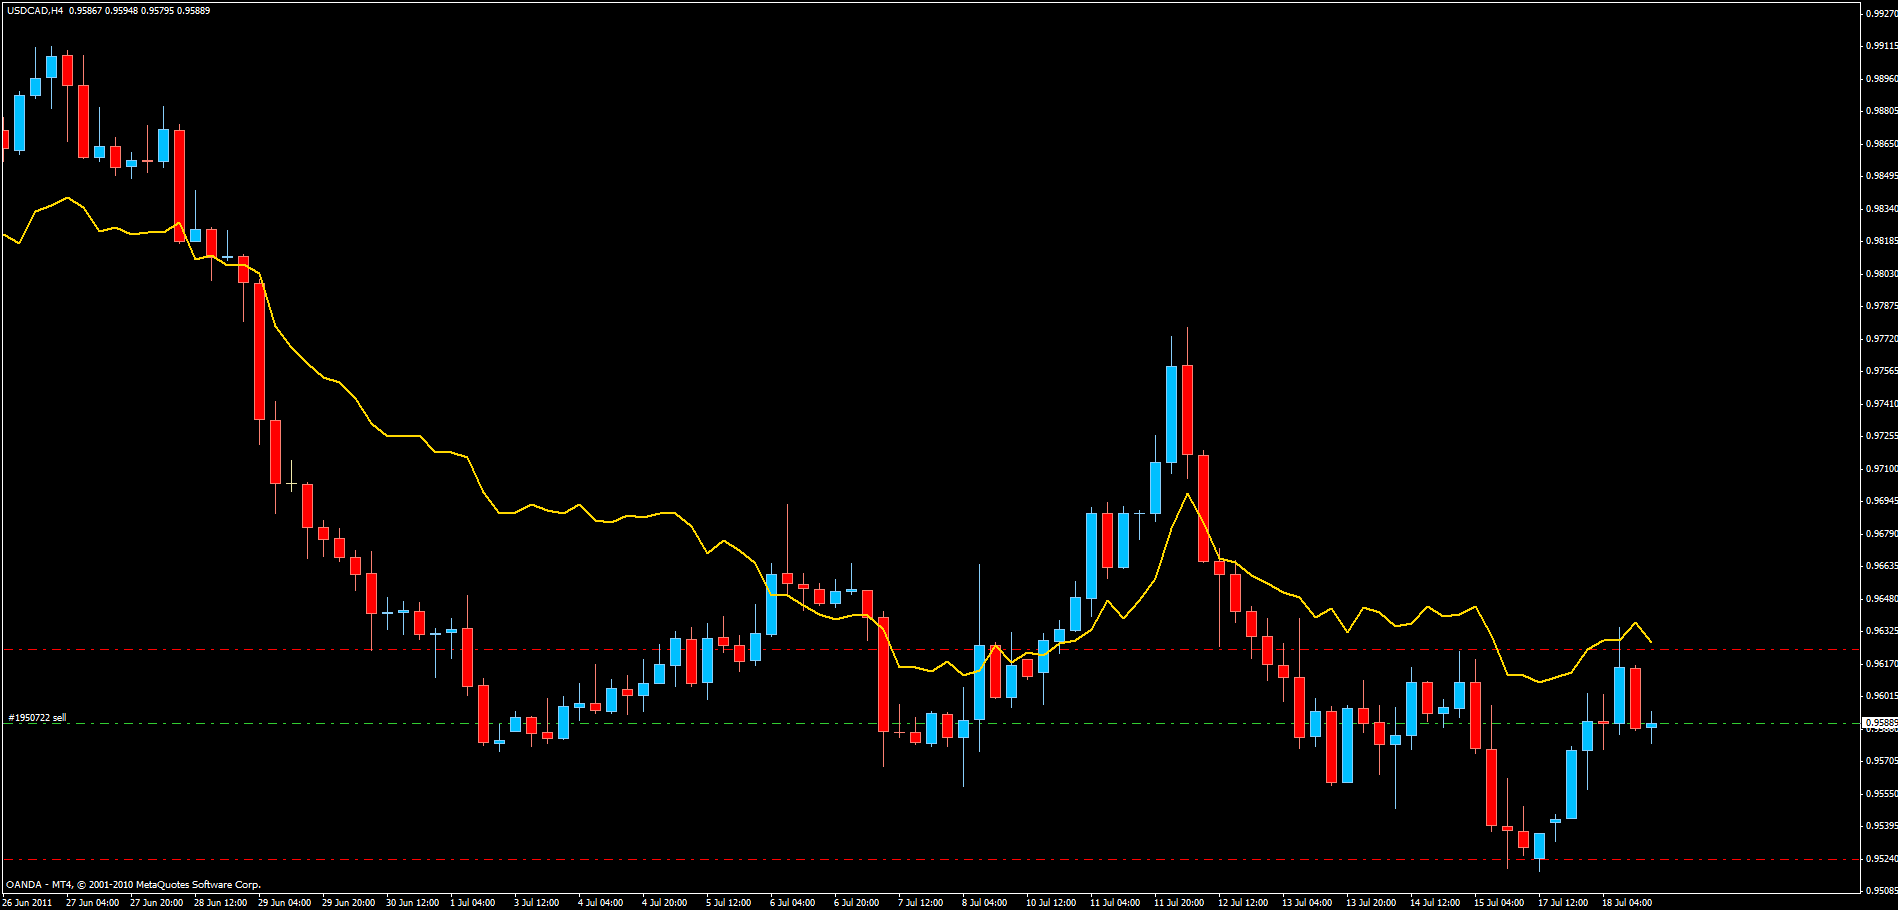
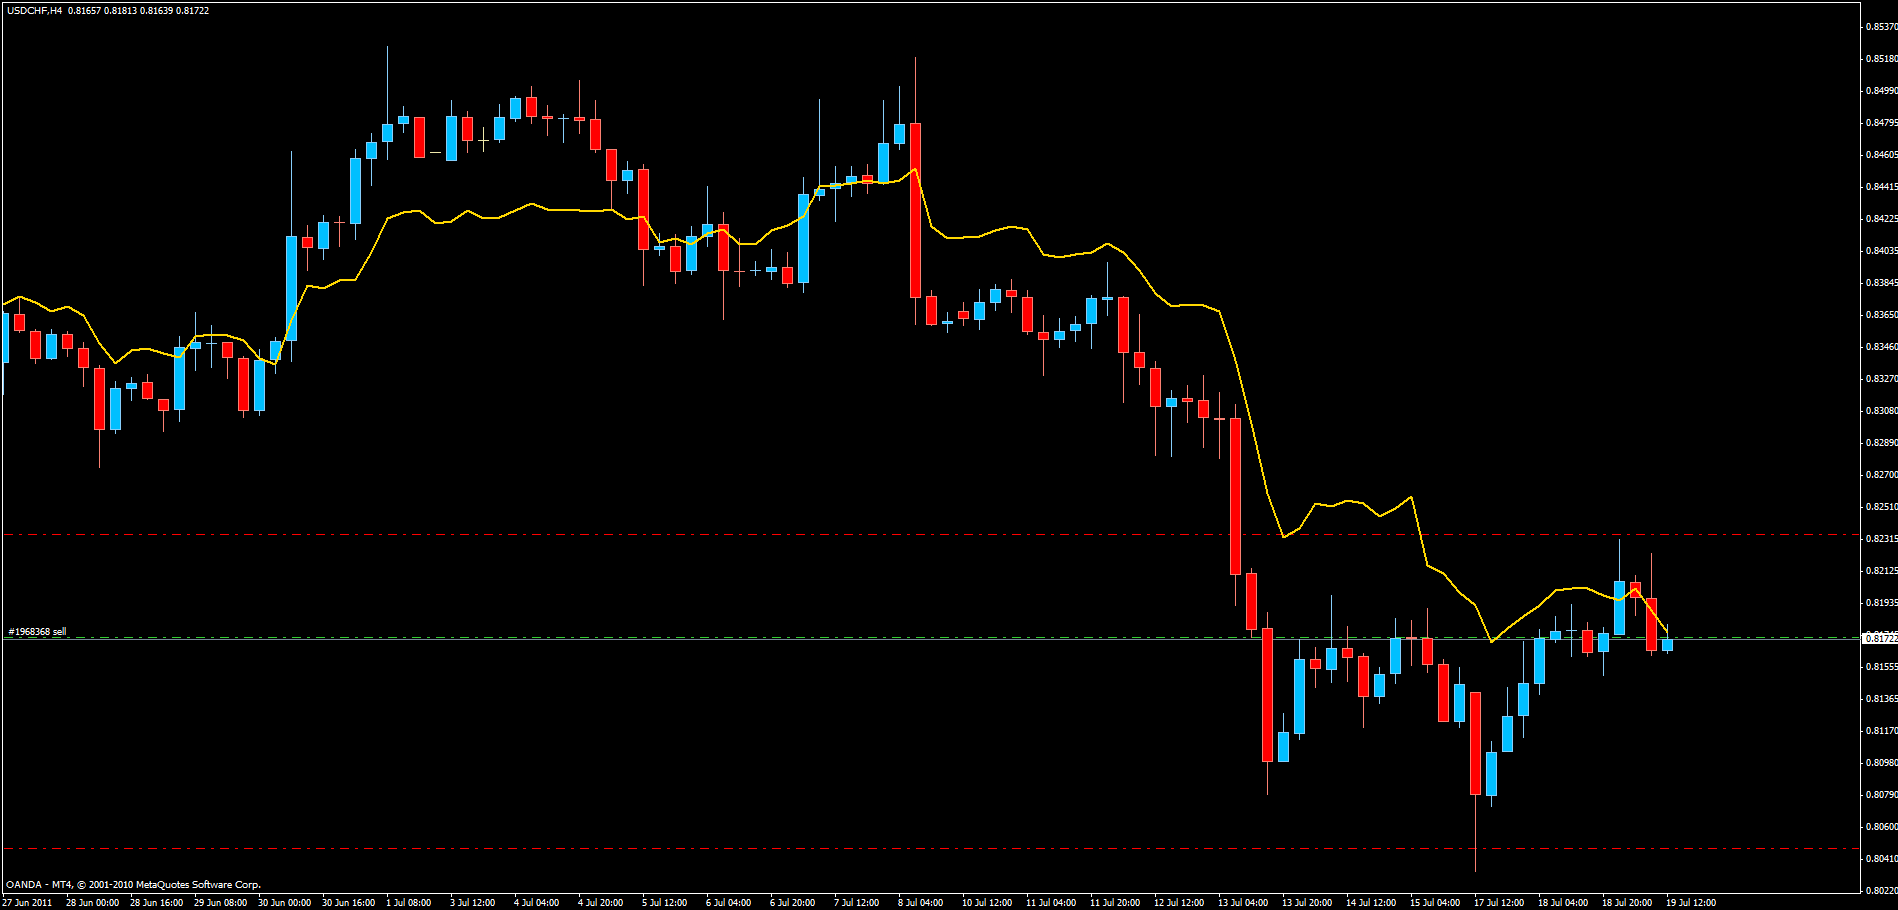
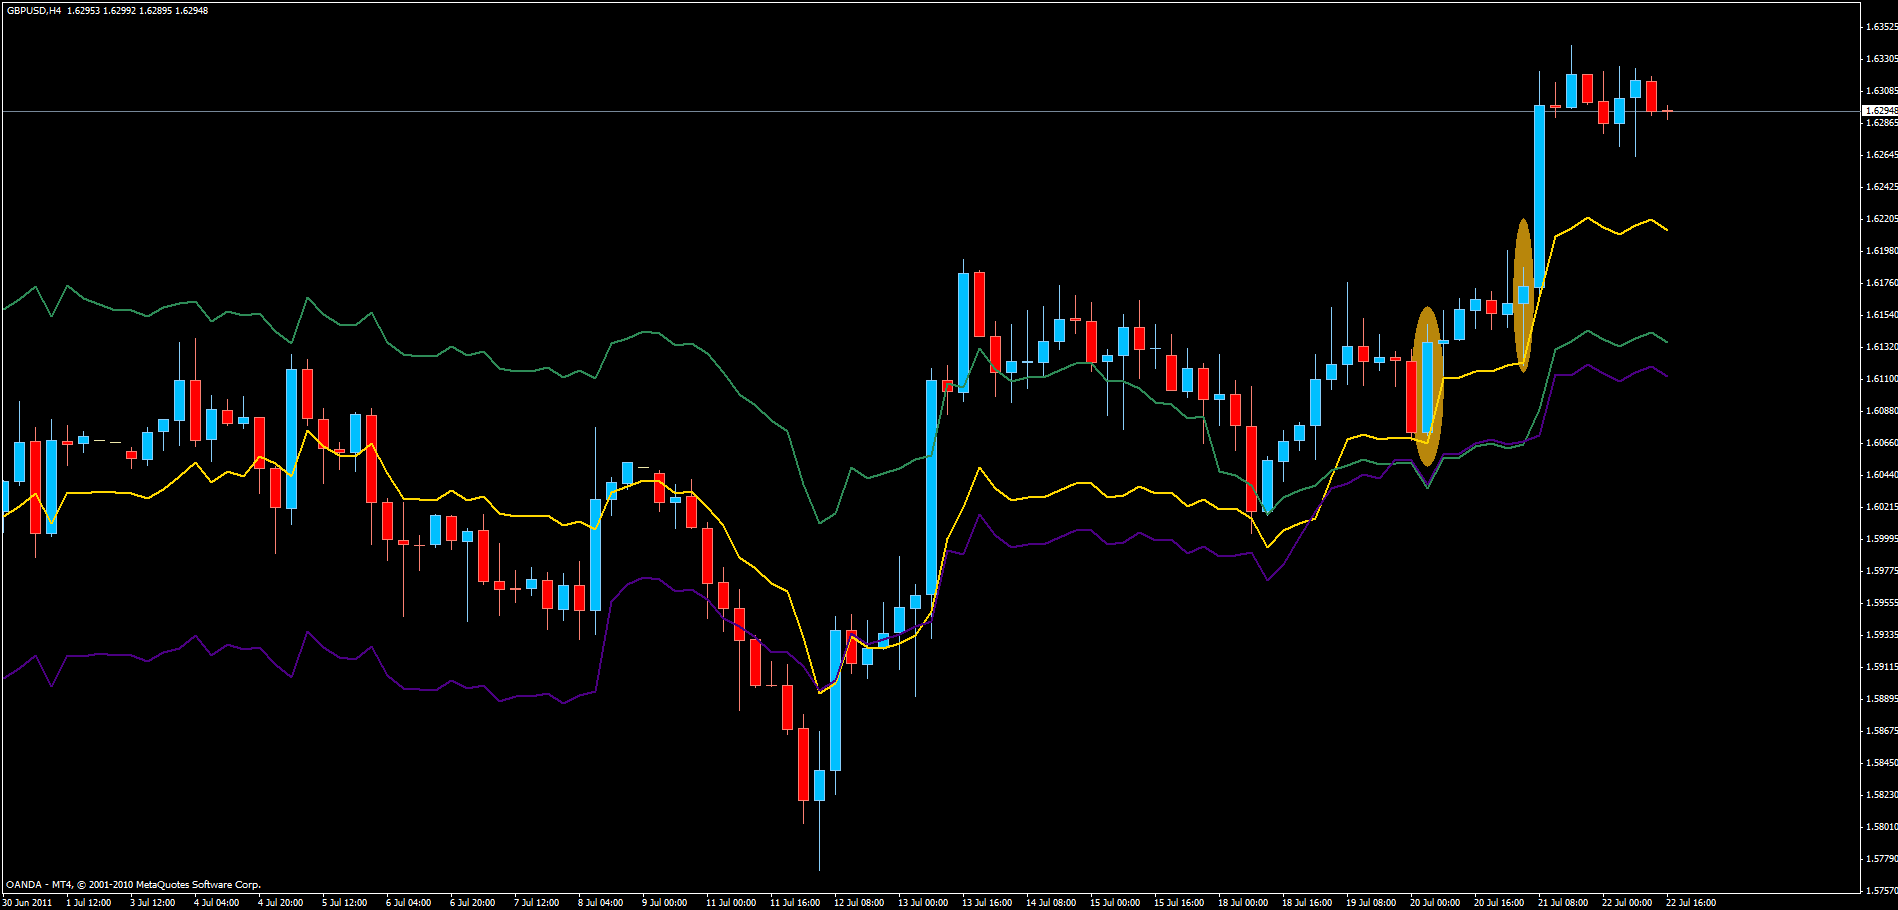
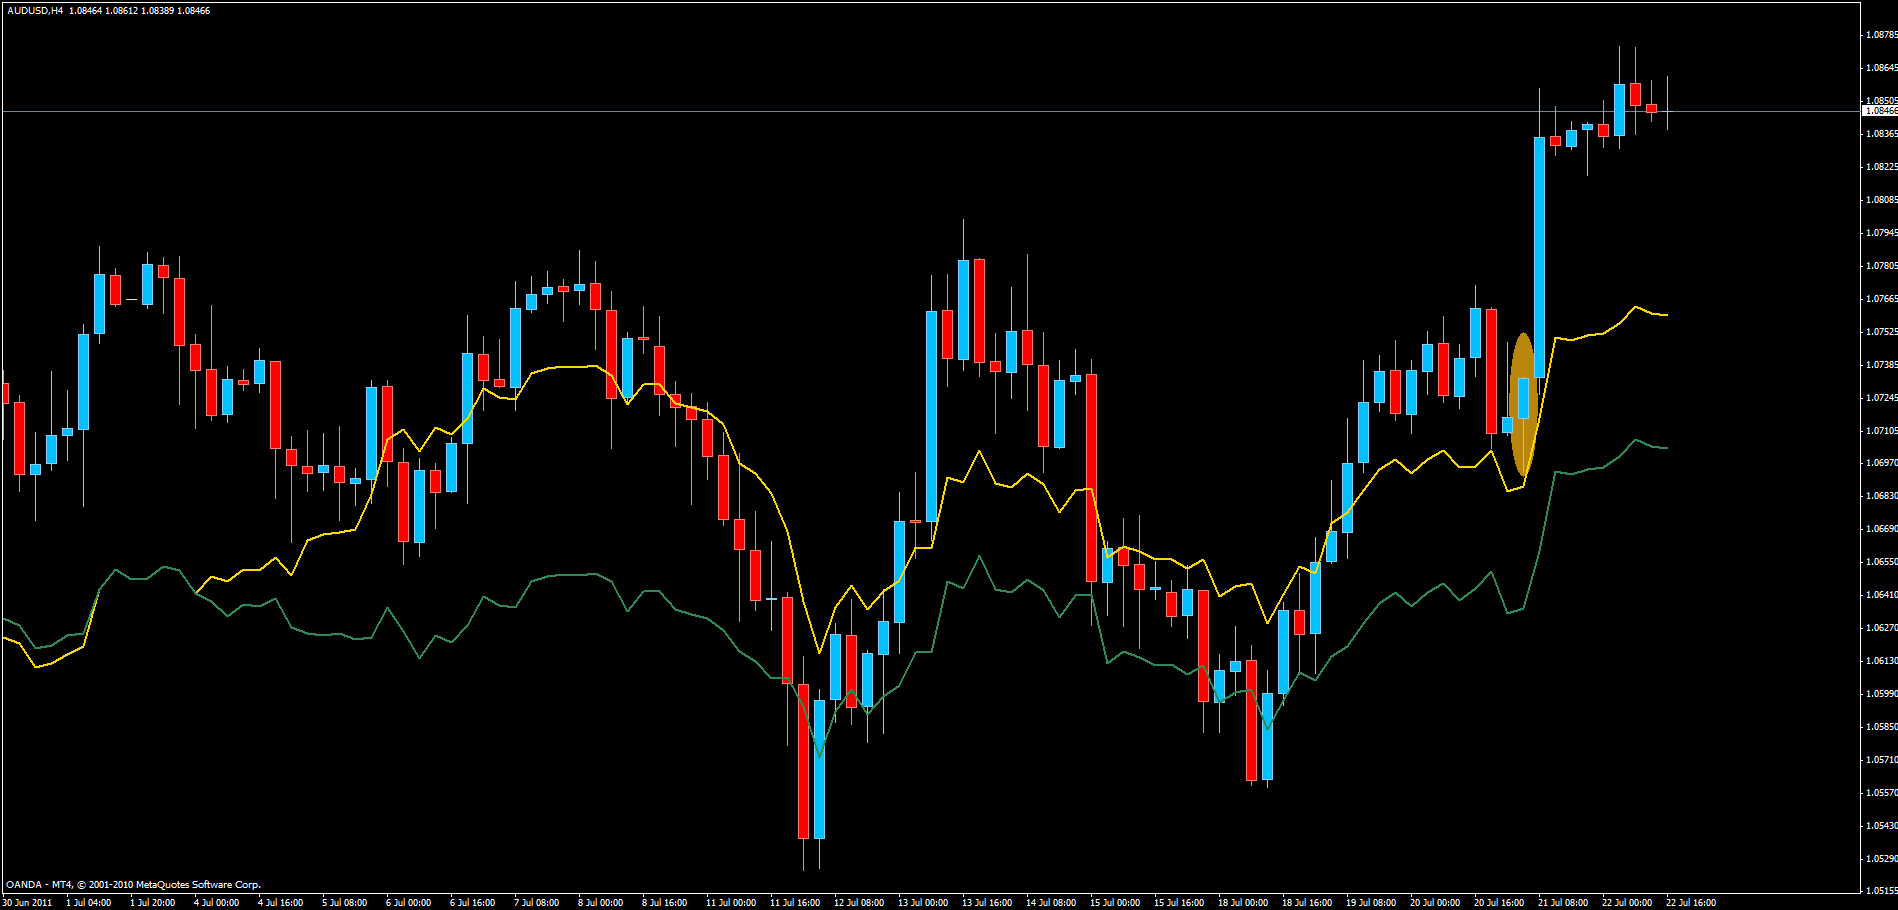
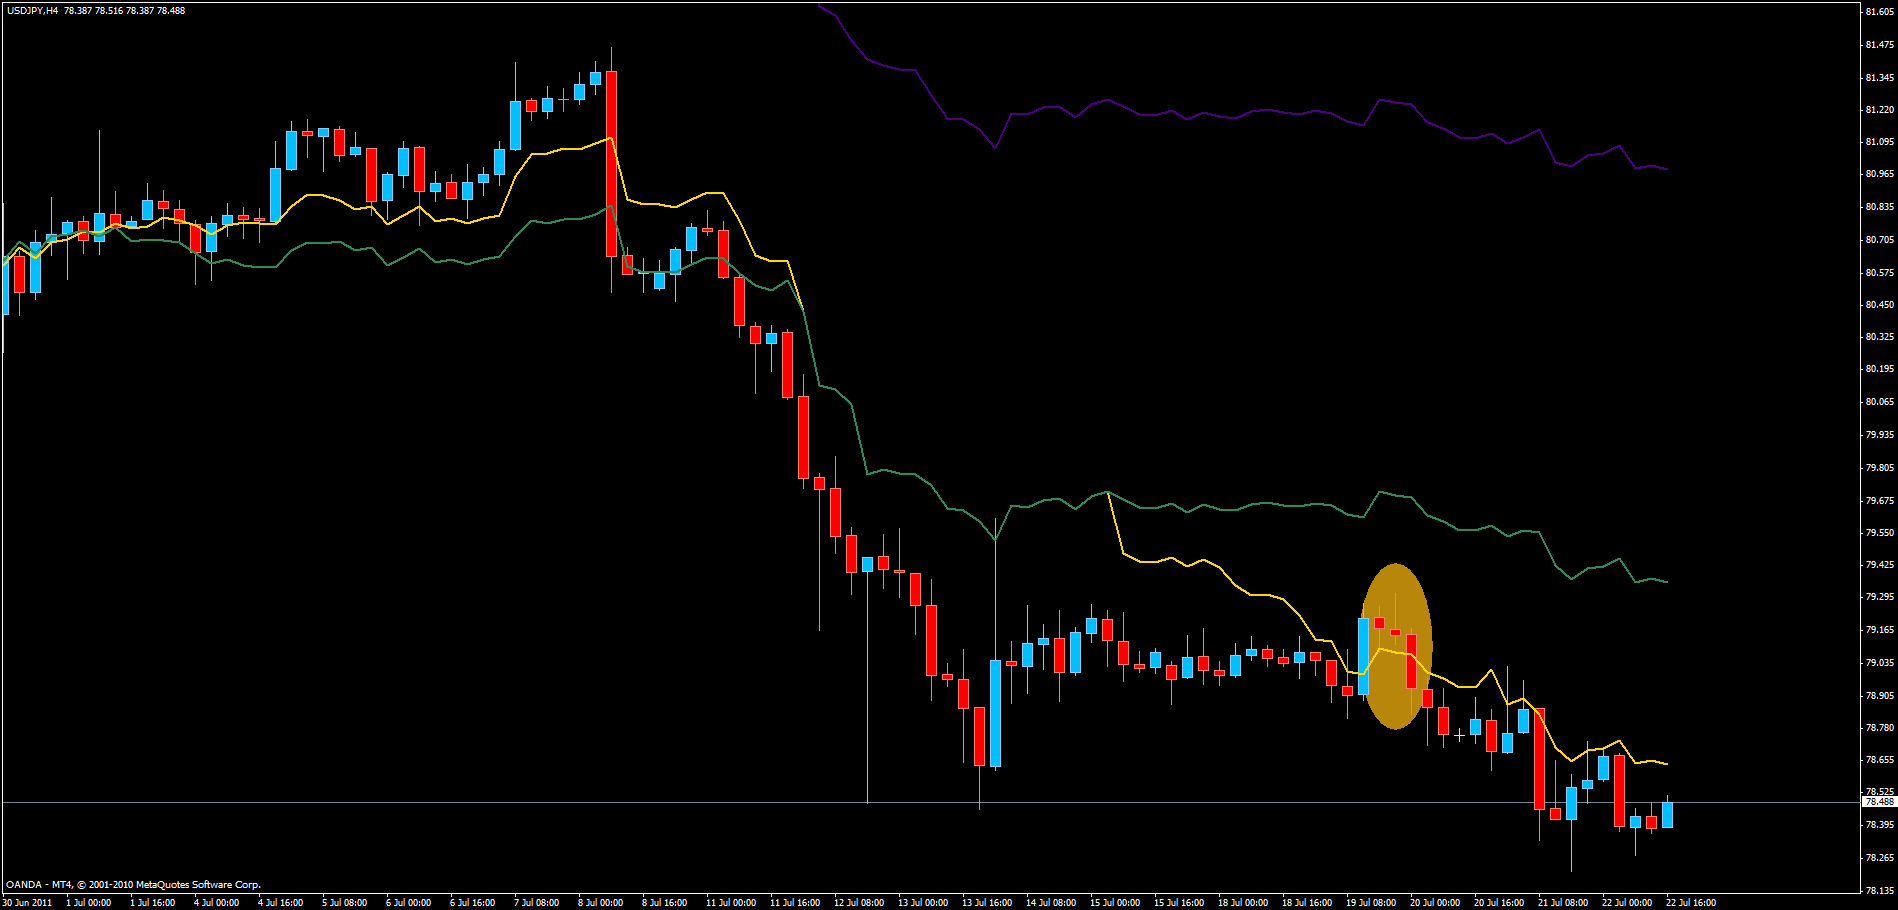
My way of deciding which direction price is more likely to go is by using the Pivot MA which will from now on be called the moving pivot. If price is below the moving pivot I will only be looking for short trades and vice versa. In other words, the moving pivot decides my bias.
Once we have a bias we then look for good trade setups by looking for bar formations.
Trades may only be taken if both moving pivots give the same directional bias. No need to fret over trading against the higher time frame anymore, ever… Very simple and definitely always with the trend.
For those unfamiliar with bar formations, What is a Japanese Candlestick? | Japanese Candlesticks | Learn Forex Trading or Japanese Candlestick Charting Explained or Candlesticker by Americanbulls.com - Candlesticks or any other site in the vast Google universe will bring you up to speed.
Since the moving pivot tells us the bias, logic also suggests that the higher above the moving pivot or the farther below, that price goes, the bigger the risk becomes that price is reaching an extreme and may retrace or even reverse.
For this reason I will be careful taking setups that form when price has already moved far above or below the moving pivot.
Next I’ll discuss briefly setting up the trade itself.
There are four things that must be known in advance before any trade can be set up:
- entry price
- placement of stop loss
- position size aka account risk percent
- placement of take profit and/or where to move stop loss to break even
1-2. Generally I will enter on the break of the bar setup but there may be situations where I’ll choose to enter on the break of one of the bars in the formation instead of on the break of the high/low of the whole formation.
Likewise the stop loss will generally be placed a few pips beyond the high/low of the formation, but in some situations I may choose to use the high/low of one of the bars in the formation instead of the high/low of the whole formation. These choices will be discretionary and when I make such exemptions from my general principle it will always be to reduce an otherwise to large stop loss.
- I’ve been interested in the mathematical formula known by traders and gamblers as the Kelly criterion for some time.
The Kelly criterion is a mathematical way of determining the optimal percentage of your account to risk on a trade. There are two drawbacks. One, it requires that we have reliable win rate and risk/reward statistics and two, it’s based on the assumption that these stats will hold up. A prolonged losing streak could have a profound effect on an account traded with the Kelly criterion. Likewise the positive effect of a winning streak can be huge and over enough time these two balance each other out. The key is being able to keep trading during a losing streak and stomach the equity swings.
There’s also the possibility of trading a partial Kelly criterion. For instance, if the Kelly formula suggests risking 40% of your account, using a partial strategy you would divide this percentage by a number of your choosing.
From start until I reach 40 closed trades I will be risking 2% per trade. There will only be one open trade at a time. Once I reach 40 trades I will start using a partial Kelly criterion for determining risk percentage, this will have to be adjusted continuously as statistics change.
I’m going to divide the Kelly risk percentage by five to make it mentally easier to stomach it. This may indeed still result in very high account risk percentages, but then that is the whole idea of the Kelly formula.
If you want to learn more about this subject, have a look at these links: Kelly criterion - Wikipedia, the free encyclopedia
Money Management Using the Kelly Criterion
http://www.pitt.edu/~sorc/trade/files/RiskManagement/kelly.pdf
This post is by someone who knows what he’s doing and his experience is well worth taking note of: http://forums.babypips.com/forextown/31062-dead-pips.html#post267753
- Where to take profit is often the hardest part to decide and it is often the part that decides whether a trading system is profitable or not.
Let’s begin with the easy part. I will be looking to move my stop loss to break even on all trades when they have reached around 1R.
The hard part is to decide where to take final profit. In general I will be looking for trades where I can expect to get at least 2R from the setup. My standard take profit will be in some location around the 2R level which also agrees with the supply/demand in the chart.
On occasion I will try to let trades run if I see potential for them to do so.
As you see I have general principles that I adhere to and some hard rules that will never be set aside, such as the use of stop losses. But there are other areas where I will make judgment calls from trade to trade as I find that it is difficult to create one size fits all rules for these areas. I’m sure many people will disagree with me on this, but this is what seems to work for me.
Due to my full time day job I’m mostly unable to trade the shorter time frames. I will be focusing on the 4H time frame.
Included in the template are moving pivots on all time frames except the monthly. The periods are set like this:
TimeFrame; Color; Moving Pivot Period
1min LIMEGREEN 240 bars = 4 hours, 1/2 money center trading session
1min CRIMSON 480 bars = 8 hours, one money center trading day
5min LIMEGREEN 48 bars = 4 hours, 1/2 money center trading session
5min CRIMSON 96 bars = 8 hours, one money center trading day
15min GOLD 288 bars = represents three 24H trading days
15min SLATEBLUE 1536 bars = represents 16 24H trading days, roughly three weeks
30min GOLD 144 bars = represents three 24H trading days
30min SLATEBLUE 768 bars = represents 16 24H trading days, roughly three weeks
1H GOLD 72 bars = represents three 24H trading days
1H SLATEBLUE 384 bars = represents 16 24H trading days, roughly three weeks
4H GOLD 18 bars = represents three 24H trading days
4H SLATEBLUE 96 bars = represents 16 24H trading days, roughly three weeks
Daily GOLD 3 bars = represents three 24H trading days
Daily SLATEBLUE 16 bars = represents 16 24H trading days, roughly three weeks
Weekly SLATEBLUE 52 bars ~ roughly 1 year
SLATEBLUE - always represents 16 24H trading days, roughly three weeks, except on Weekly where it corresponds to one year
GOLD - always represents 3 24H trading days
LIMEGREEN - always represents 4 hours (1/2 money center trading session)
CRIMSON - always represents 8 hours (one money center trading session)
These settings are correct for my broker’s opening hours, if you use a different broker you may have to adjust the periods to make them correspond correctly.
Last, but not least some cherry picked chart examples to get an idea of what we’ll be looking for:
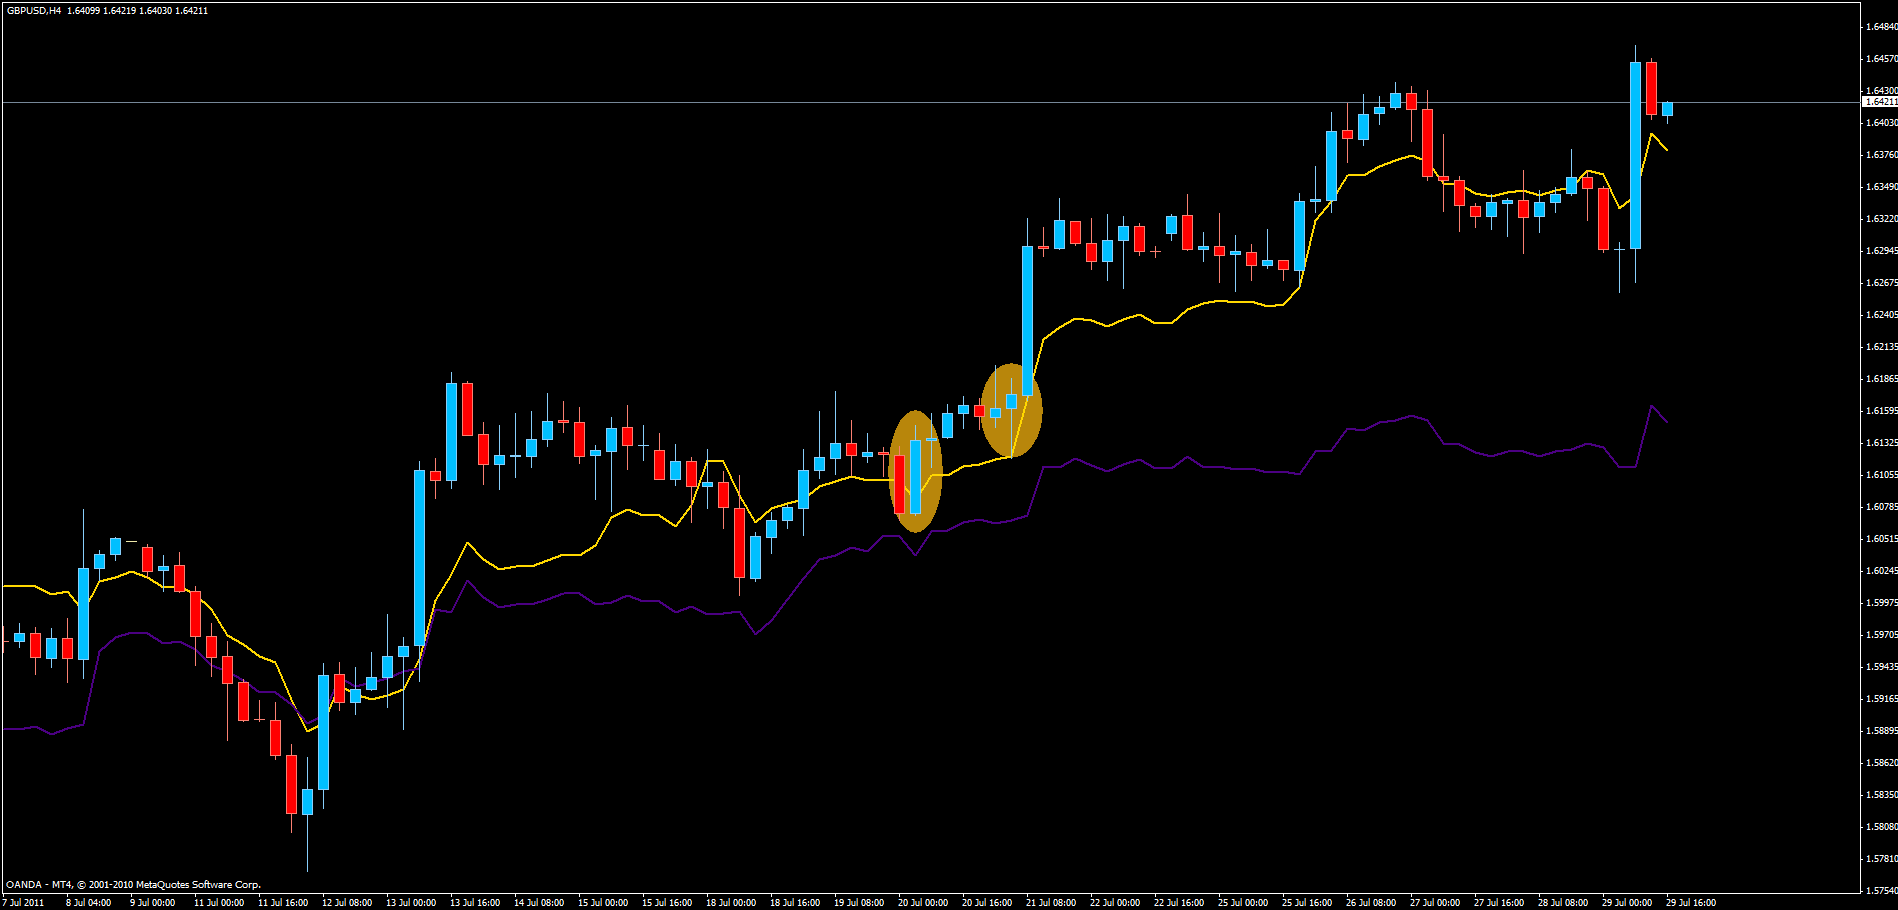
http://i923.photobucket.com/albums/ad76/o990l6mh/3ba65e37.gif
Bullish outside bar to the left and bullish pin bar with the trend following a bearish pin bar.
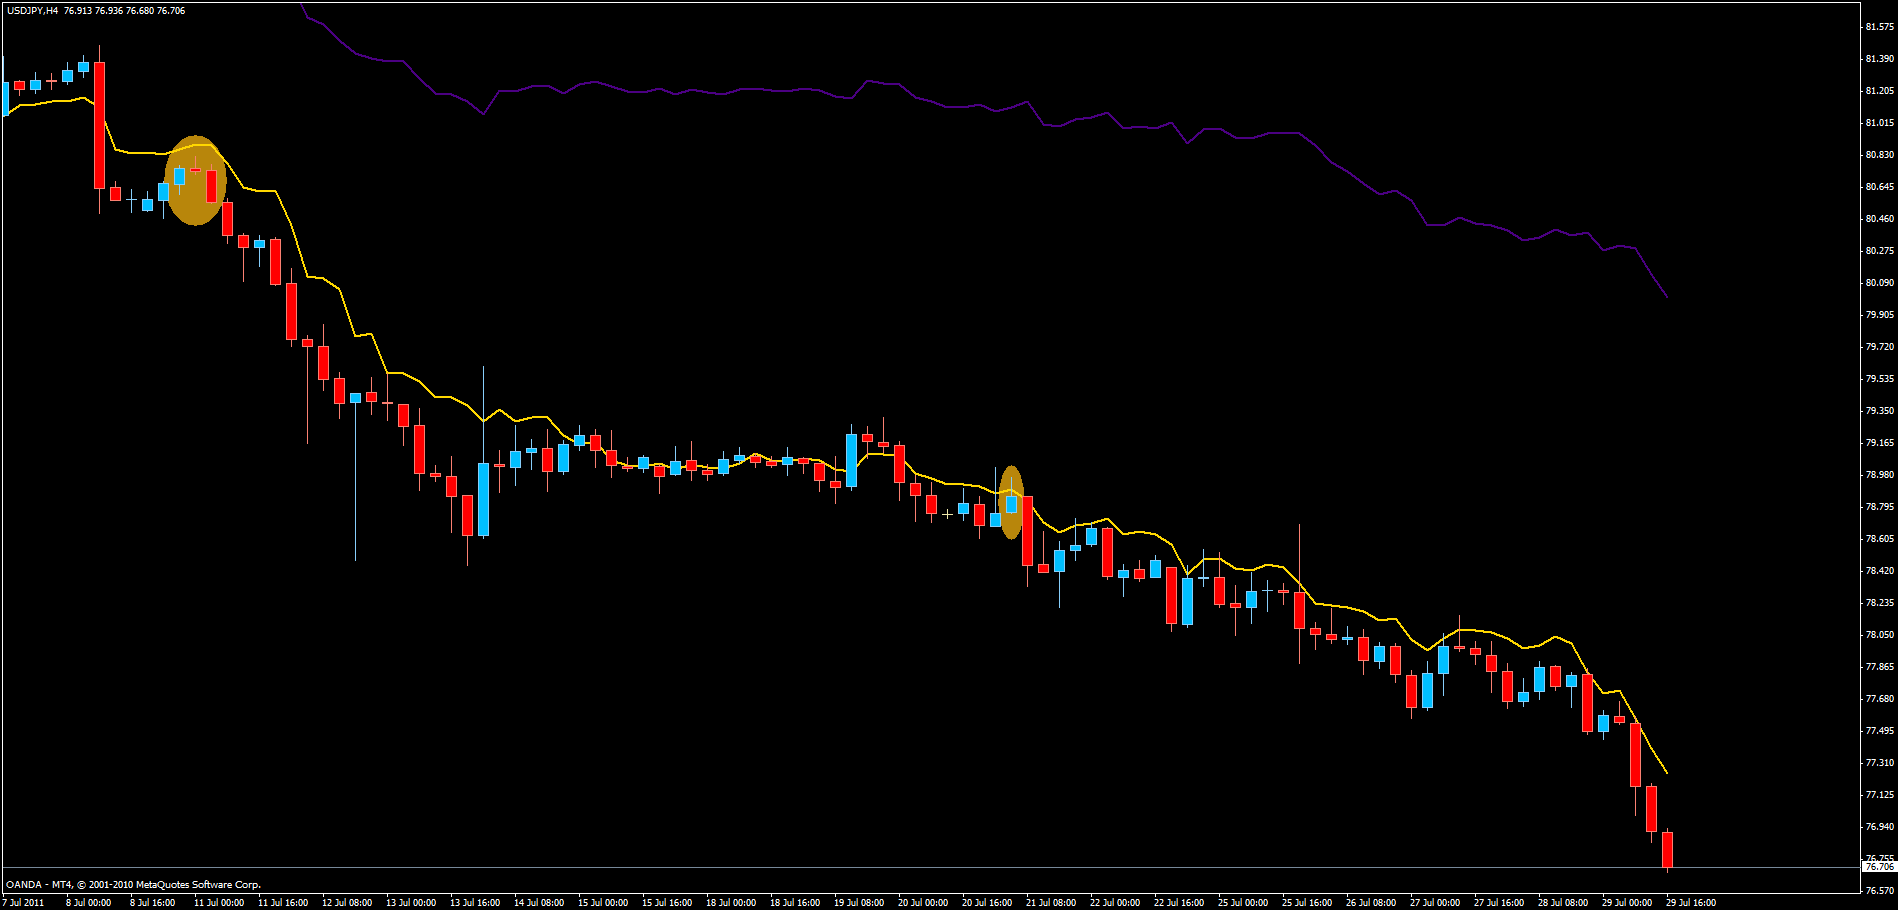
http://i923.photobucket.com/albums/ad76/o990l6mh/ac23a24c.gif
Evening star to the left and inside bar to the right.
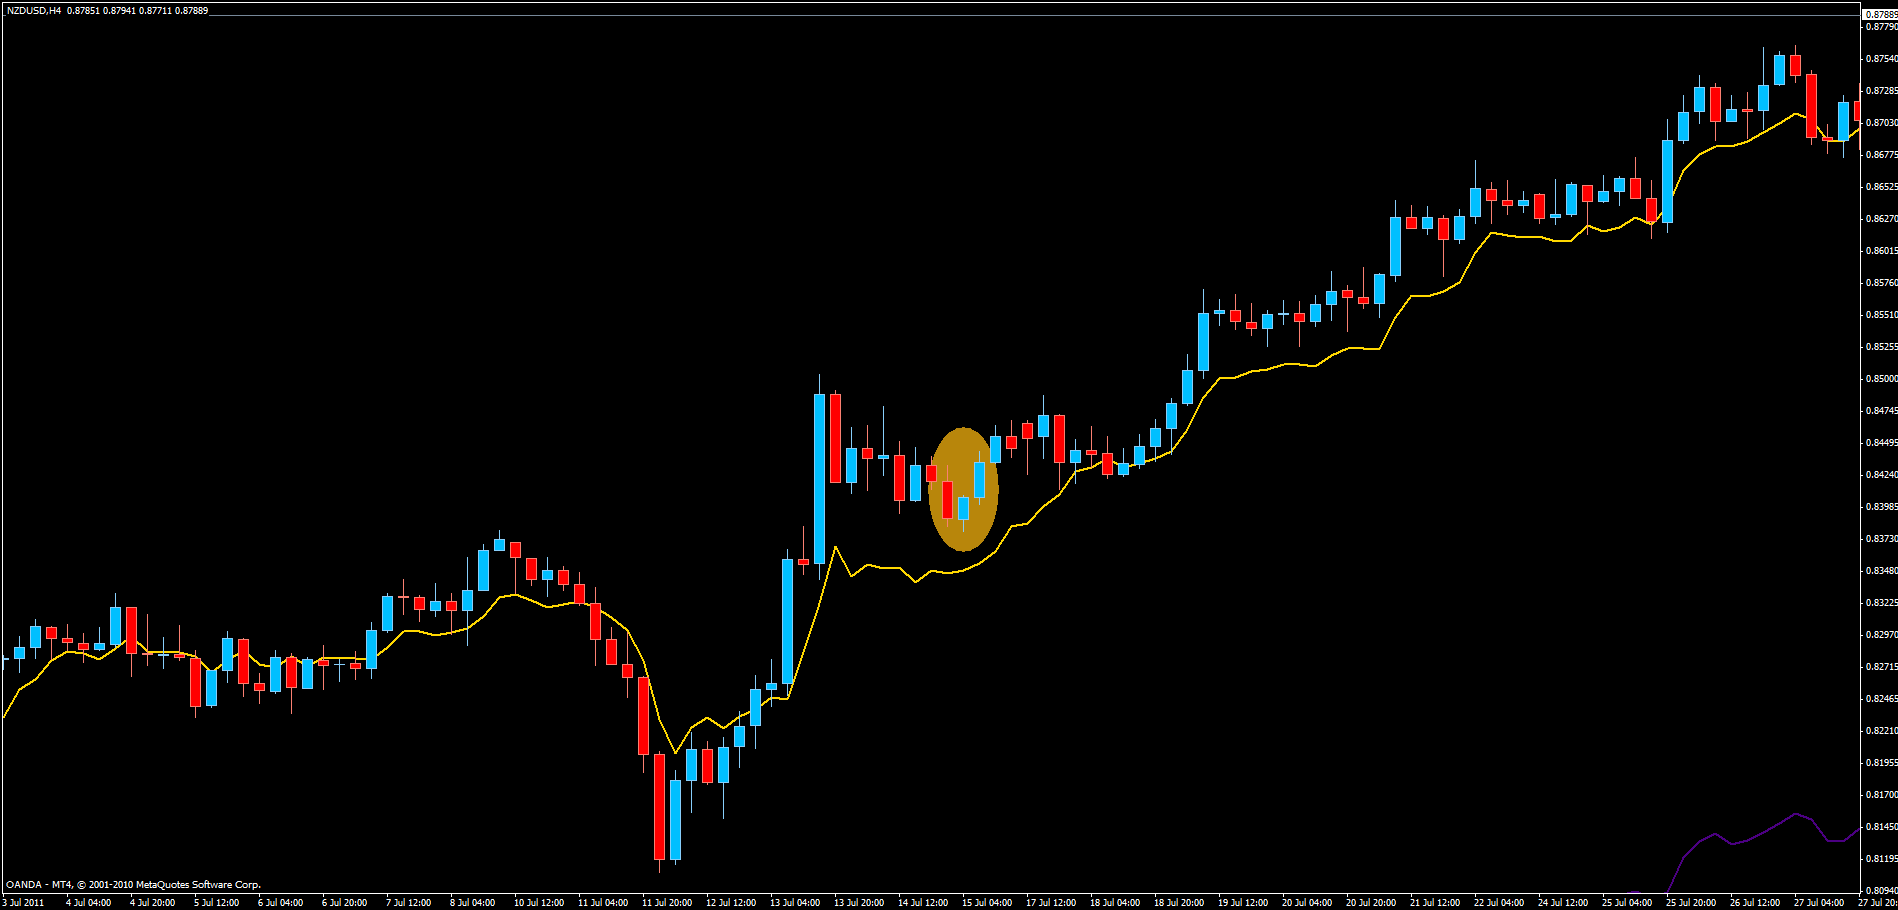
http://i923.photobucket.com/albums/ad76/o990l6mh/702eb562.gif
Three inside up formation
Finally I’d like to say a big thanks to DodgeV83 who kindly helped me with the FoxPivot indicator which was not doing what it ought to in the beginning, but which now works perfectly thanks to him.
-phoenixfoundation-.zip (2.73 KB)
