See the post I asnwered you previously. The middle chart is the chart I use to mark my lines. I use that much info.
I will answer your question tomoz morning my time as 1am here and going to bed.
On another note I have now just take part profit on the two recent daily trades on GBPCAD and AUDCHF. To see the setup I traded here which were a bullish engulfing bar and bearish pin bar please see previous posts. See charts:
Thank you for opening a Price Action thread here at babypips. Your trading experiences and valuable comments are highly appreciated. It is a goldmine to all of us who desire to learn true PA. Good luck and more power to your Forex Online School. :32:
Was checking EURCAD daily chart and saw the kind of pattern we’ve been talking about (downtrend -> reverse_to_test -> downtrend). Seeing no obvious PA on the daily, i quickly popped into the weekly, and…(see below), seems like a BEEB (though the candle has NOT YET CLOSED!)
With respect to RR, what Johnathon said earlier comes to mind:
–> “…but I know this setup is from a very solid area and the price action is very large and obvious I will take it…”
–> And: if you’re consistently profitable ( more trades won than lost), you need smaller RR.
Well, anything can happen in forex, and nobody knows what exactly would happen, but this is how this newbie sees it may go:
-> My S/R line is at: 1.34499
-> I would put the stop at just above the previous weeks’ highs: 1.32538
-> Entry at the low of the weekly BEEB: now at 1.30265
-> First support area (read: take profit ) at around: 1.29707
-> Second support area (read: take profit) at around: 1.27950
Yes it is a BEEB and also great level marked on tge daily chart. Well done mate. However, swing points! Swing points. We want to go long from a swing low and short from a swing high. We need space to trade into.
If we don’t do this we are trading right into the most recent and important support or resistance area.
Okay so on the weekly chart of the EURCAD you are looking to go short from a swing low. This should be going short from a swing high. Because you are doing this you are trading into the most recent support area. Or price is sitting right on it.
Ok the other point is the longer the time frame generally the more important the support or resistance. For example it is fine to mark you S/R on a daily and weekly chart and then look for PA on a 4hr or 1hr chart. You should not mark support on a lower time frame and then go looking for PA on a higher chart as the S/R is not as important. For example, you have marked your levels on a daily chart and then gone to weekly to look for PA at that level. I would def recommend marking all your levels of the daily except for the longer charts your are going to trade. For example mark you S/R on a daily and use these for trading daily,4h and 1hr charts but when trading weekly mark your S/R on weekly. Make sense?
Another thing I want to talk about is something that is called Big Round Numbers (BRN). These are major psychological levels in the markets such as (in this market) 1.2500, 1.300, 1.3500 etc etc. These levels can act as support and resistance a surprising amount of times. The reason these work is because people tend to set orders and take profit at these levels. People either round of to the round number or like Dudest has done, they shave a pip of either side if the BRN (Dudest planned take profit). Notice that price hasn’t been able to break the BRN of 1.300 in this market yet? For this to go lower a clean break will be needed.
Lastly I do think this will probably go lower in the coming weeks. I am actually looking to sell another euro pair next week. That doesn’t mean for me this is tradeable as because of the reasons stated above it is not. As I always say it is the trading habits you get in. So yes you could get away with this trade if it drops lower but over time you will not and you will lose more than you will win. We must only take the best setup and part of that is taking them from good areas. And then not being sucked in and kicking ourselves when price does go the way we thought and we are not in the trade.he next five times the trade will go onto lose and so what if you got away with this and have a win occasionally, the other five will get you!
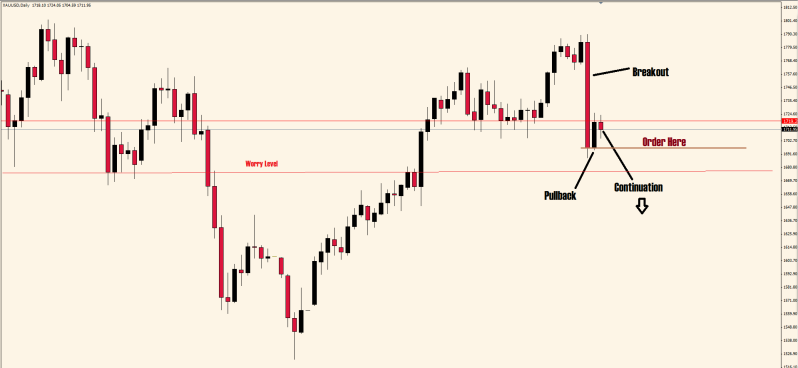
Gold certainly looks promising. It’s a nice bearish engulfing rejected right off of a resistance line. IF you move up to the monthly it also has a pin candle from last month that would support the weekly. The weekly is what I would consider at that top of an uptrend because it has already made two Higher Lows after a Higher High (this would be the second HL). I would probably enter when it crosses the brown line on the chart below (daily TF). It has hit a fairly strong resistance and formed what looks like a nice BPC pattern. The one problem is that you would be trading into a support that is pretty obvious on the daily (lower read line, worry level)… Not so much on the weekly, but still there. I still might take this trade and just move it to break even when it hits that level. If (most likely) it hits my BE I’ll just reenter if it looks like it will continue down again.
Determining when the trend has/is changed(ing) is something that I don’t think has been covered in this thread. Personally, I determine it by price making Higher lows and using lower lows to support that which gold is in fact doing on the weekly’s. Jonathon might (probably) does it different, but it’s what works for me. The waves are kind of messy and I’m not sure I would even take this trade purely off the weekly. Instead I would look at the daily or 4H to get a good entry with a minimum SL.
good to see you posting. Two days ago when we saw that rejection candle I thought the chance for a decent pullback was looking likely. This Pin however has failed to break lower and price is once again testing the recent highs.
The problem price will have trading back lower is all the traffic it will encounter on its way back down.
Now what is important is the box that price is stuck in at the moment. Notice how we have had rejection candles in this box both ways that touch the top and bottom of the box almost to the pip? It is to early to say anything until we have a clear break of this box. Once this happens we will normally break out hard and fast and then price will retrace and test again. It is here will will get our entry.
It is much easier to explain on a chart. So if price break the box higher we would look for price to rotate back lower and for us to get long and if it breaks lower for price to come back up and test lows to get short. make sense?