IronHeart's trading journal

Hello all!

Some of you may already know me from Tymen’s popular thread - [B]“Finest in trend trading”[/B] and for those who don’t, I have been a follower of the financial markets for 3.5 years and actively trading for the past 1.5 or so years.

During this time, I have demo traded, live traded and now I’m back to the drawing board with new techniques and for knowledge to trade successfully with.

Thanks to everything I’ve learnt from [B]Tymen Wortel, Graviton[/B] and many other peers, I have created my own trading plan and am currently in the process of demo’ing it.

I have already been demo’ing my latest strategy for 2 weeks (the results of which I will share) but have been encouraged to keep a journal on BabyPips.

So here goes!

For anyone seeking some background to the methods I use to trade here, I would thoroughly recommend reading the following two threads:

[ul]
Finest in trend trading
[/ul]

[ul]
Multi-Time Frame Trend Trading
[/ul]

Without further ado - on to the trading plan!

[B][U]2 strategies in 1[/U][/B]

Why 2 strategies in 1?

Well…I begun developing my strategy with [B]counter-trend[/B] trades and while these were very successful in backtesting, my tests were showing much larger potential in [B]with-trend[/B] trades.

Of course, when I talk about potential, I mean in terms of Risk:Reward ratios.

So I adapted my strategy to take advantage of price going against the trend as well as with the trend.

Next up: The counter trend trading plan…

[U][B]Counter Trend Trading Plan[/B][/U]

[B][U]Morning Routine[/U][/B]

Every trader needs a morning routine! This is a list of things you will do every morning before you begin trading, and here is mine:
[ul]
[li]Open Lot Calculator to calculate ideal position size.
[/li][li]Look at Economic Calendar to identify important news releases.
[/li][/ul]

[B][U]Indicators to use[/U][/B]
[ul]
[li]All charts will contain Bollinger Bands (BB) at standard settings (20-period with STD=2.0).
[/li][li]The 4H chart will also contain Bollinger Bands with STD=1.0 overlaid with the other BB.
[/li][li]The 15M chart makes use of the Stochastic Oscillator with settings (8,3,3).
[/li][/ul]

[B][U]Entry[/U][/B]
[ol]

[ul]
[li]Begin scanning currencies from the [B]4H[/B] time frame - we are looking for how price action (PA) interacts with the BBs.
[/li][li]If BBs are level (both outer bands and the mid-band), a breach of the outer BB is a valid signal for entry.
[/li][li]If BBs are contracting (in other words, whenever the outer-bands are not expanding), each breach of the outer-BB is a valid signal for entry.
[/li][/ul]
[ul]
[li]Entry into a trade is only taken from the 15M time frame.
[/li][li]To enter, construct a regular 2 candle count back line (CBL) and wait for a close beyond the CBL line.
[/li][li]If the close beyond the CBL line coincides with a crossover in the Stochastic indicator (ideally from oversold or overbought areas) - enter on the open of the next candle.
[/li][/ul]
[/ol]

[B][U]Stop Loss[/U][/B]
[ul]
[li]Stop loss must be placed at the last swing high/low + spread.
[/li][/ul]

[B][U]Break Even[/U][/B]
[ul]
[li]Set SL to Break Even (BE) when R:R reaches 0.5. That is, the point at which reward is exactly half the size of the Risk.
[/li][/ul]

[B][U]Position Management[/U][/B]
[ul]
[li]Entries are made with 1 lot to maximise R:R.
[/li][li]Each entry will risk 2% of the account value.
[/li][/ul]

[B][U]Exit Rules[/U][/B]
[ul]
[li]These are subjective - it depends on looking at the BBs of the home chart and deciding to stay in the trade or leaving the trade.
[/li][li]Because these trades are counter-trend - I set targets at R:R = 1, 1.2 and 1.5. If I believe price will go further, I will stay in. If I don’t fancy the chances, I will attempt to get out with at least R:R = 1.
[/li][/ul]

[B][U]Entry[/U][/B]
[ul]
[li]Stop loss must be placed at the last swing high/low + spread.
[/li][/ul]

[B][U]Trade Management[/U][/B]
[ul]
[li]Do not run any full screen applications whilst trading - you have to be able to view your trade’s progress!
[/li][/ul]

[B][U]General Trade Rules[/U][/B]
[ul]
[li]Do not entry 1H before a red-flag announcement.
[/li][li]Never move a stop against the direction of the trade.
[/li][li]Max 5 trades per day.
[/li][li]If confused or unsure, sit the trade out.
[/li][li]Close all trades by 8pm GMT on Friday.
[/li][li]Never take a flier in a good account.
[/li][li]Log all trades in journal :slight_smile:
[/li][/ul]

[B][U]Journal Rules & Post-Trade Analysis[/U][/B]
Things that must be logged:
[ul]
[li]Pair.
[/li][li]Time.
[/li][li]Long or Short.
[/li][li]Stop amount.
[/li][li]Won or loss amount.
[/li][li]Reason for taking the trade.
[/li][li]If you broke any rules.
[/li][li]Winning percentage to date.
[/li][li]Average R/R to date.
[/li][li]Profit expectancy to date.
[/li][li]Maximum profit available.
[/li][li]Profit efficiency (Actual profit / Max profit).
[/li][/ul]

[U][B]With Trend Trading Plan[/B][/U]

Exactly the same, except for…

[B][U]Entry[/U][/B]
[ol]

[ul]
[li]Begin scanning currencies from the [B]4H[/B] time frame - we are looking for how price action (PA) interacts with the BBs.
[/li][li]If PA makes a counter trend move and steps in between the outer STD=1.0 BB and the mid-BB, I will take this swing trade opportunity and expect price to continue the trend.
[/li][/ul]
[ul]
[li]Entry into a trade is only taken from the 15M time frame.
[/li][li]To enter, construct a regular 2 candle count back line (CBL) and wait for a close beyond the CBL line.
[/li][li]If the close beyond the CBL line coincides with a crossover in the Stochastic indicator (ideally from oversold or overbought areas) - enter on the open of the next candle.
[/li][/ul]
[/ol]

[B][U]Exit Rules[/U][/B]
[ul]
[li]Use Parabolic SAR and Mid-BB to decide when to exit.
[/li][li]I won’t document all of the exit rules but will recommend you to read “Finest in Trend Trading” to find out how this exit strategy works (especially from page 389 onwards).
[/li][/ul]

An example counter-trend trade

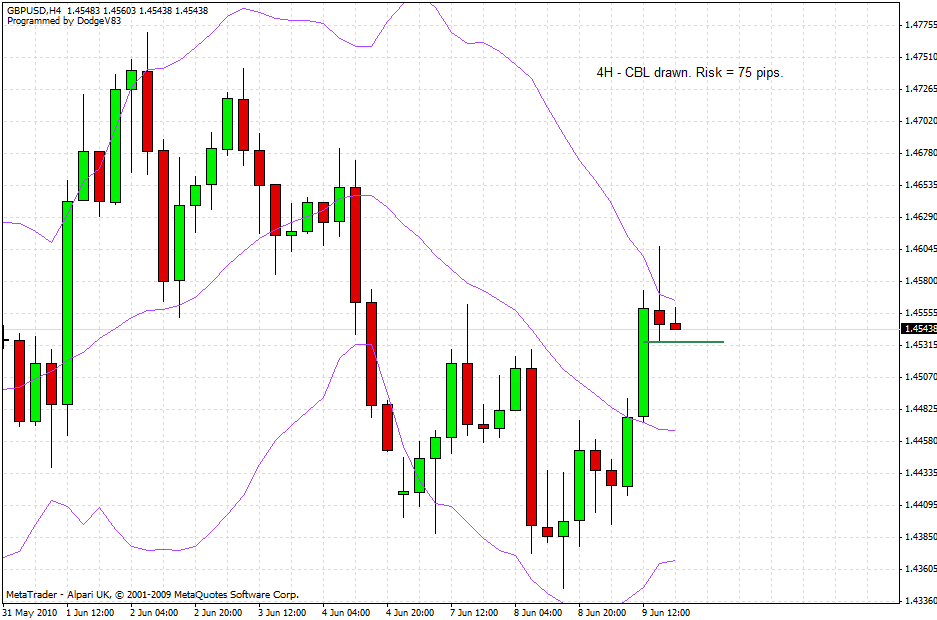
The image just below is a 4H chart of the GBPUSD.

This is a trade that I came across during my back-testing, so it is a hindsight trade.

Having said that, this type of PA fulfils the expectations of my trading strategy fully.

Notice that long-legged red candle, which breaches the upper-BB. At the point of breach, the bands were contracting and the mid-BB was heading downwards.

As soon as that breach occurs, I step down to the 15M time frame…

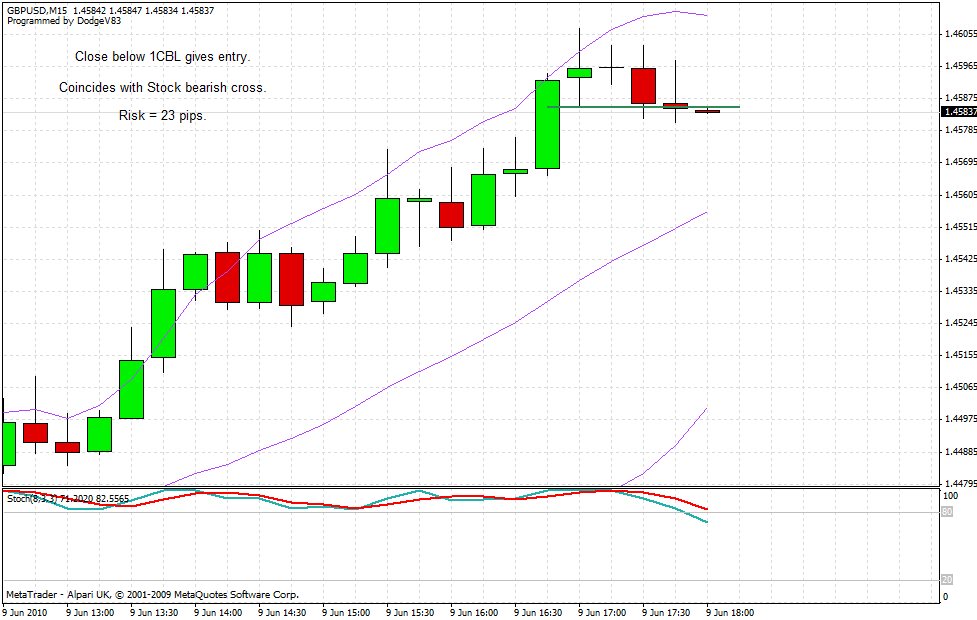
All I need to do on the 15M timeframe is keep drawing my CBL lines and wait for a close below my CBL. If the close below the CBL coincides with a bearish move below the overbought area on the stochastic, then the next open is our entry!

Notice on this 15M chart that we never get a proper entry until the very last candle.

The CBL line is the green line, which is the low of the most extreme candle (the highest one).

The second last candle on this chart closes below the CBL line and the stochastic has just gone below overbought at this point.

My entry is, therefore, at the open of the very last candle on this chart.

the Risk I have taken with this trade is 23 pips. Using proper position sizing, I have risked 2% of my account value.

The final picture

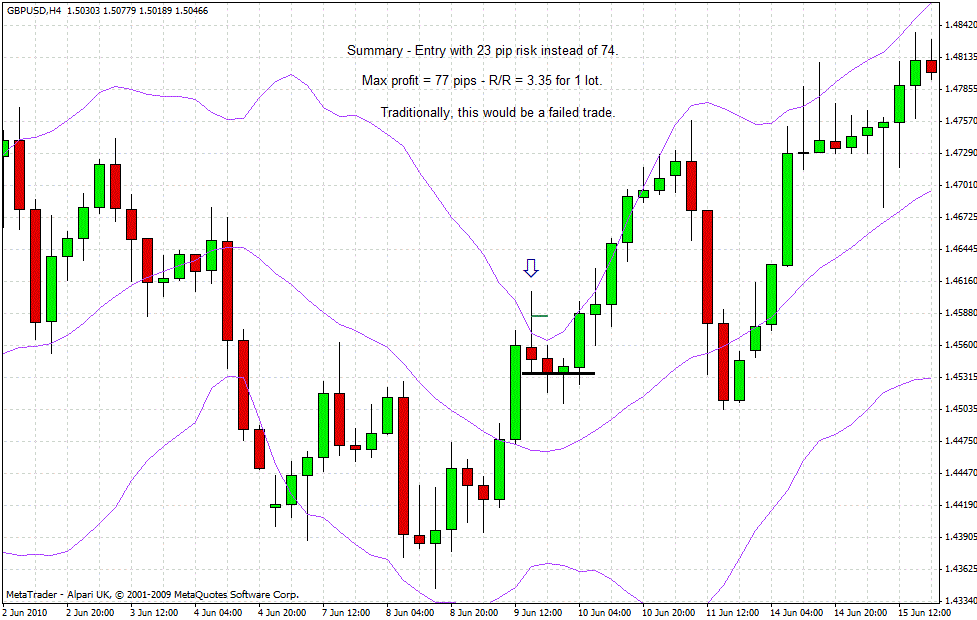
Please ignore the writing on the chart! That was not for this thread!

The green line shows where I entered this trade. The black line is completely irrelevant - please ignore that too.

Overall - This trade was entered with 23 pips of risk, the break even stop loss was set when price moved in my direction 12 pips (for R:R = 0.5) and the maximum profit available was 77 pips.

This corresponds to a maximum R:R of 3.35 for the very brave!

Of course, I would have exited this anywhere between R:R = 1 to 1.5!

An example with trend trade

Trend trading is essentially swing trading, only with a few bells and whistles attached.

Here is an example of the type of trades I try to take…

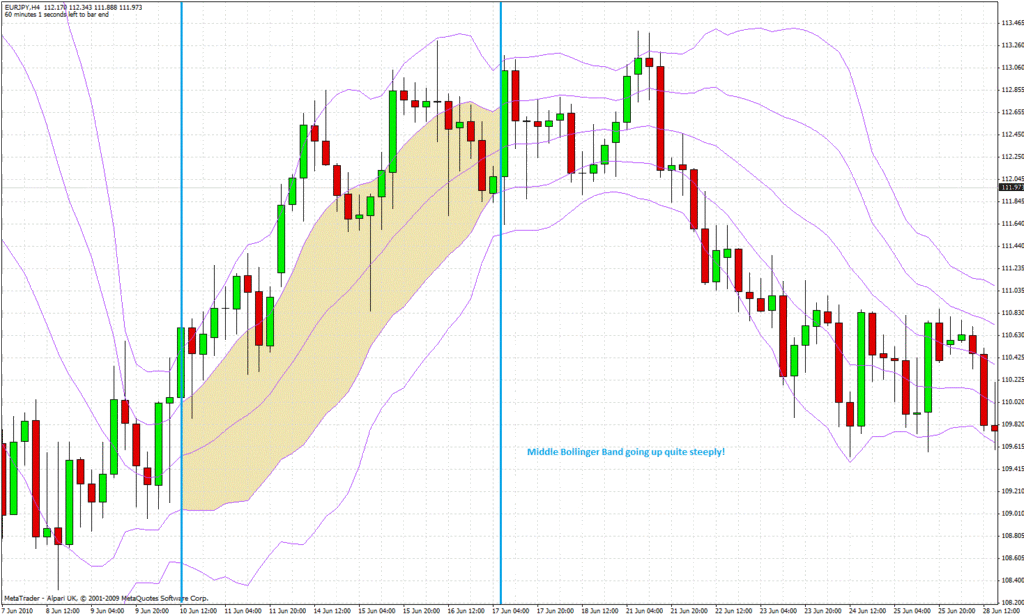
Notice the area I have marked within the blue vertical lines.

Within this area, the mid-BB is going up quite steeply. This tells you that price is trending. Although, you really don’t need the mid-BB to tell you this, just look at the price - its radically going up!

Now notice the area I’ve marked in a strange shade of yellow (gold?)…

When in a trend, price often retraces then goes back in the trend direction. The area I have marked tends to act as an area of support/resistance when in a sustained trend.

So all I really need to do this…notice when price has dropped back into the gold area (but only when the mid-BB is going up steeply!) and drop down to the 15M time frame to find a CBL entry.

I can now show you how this works 100% of the time in hindsight - the best trading method for those who have a time machine. :smiley:

Dropping down to the 15M

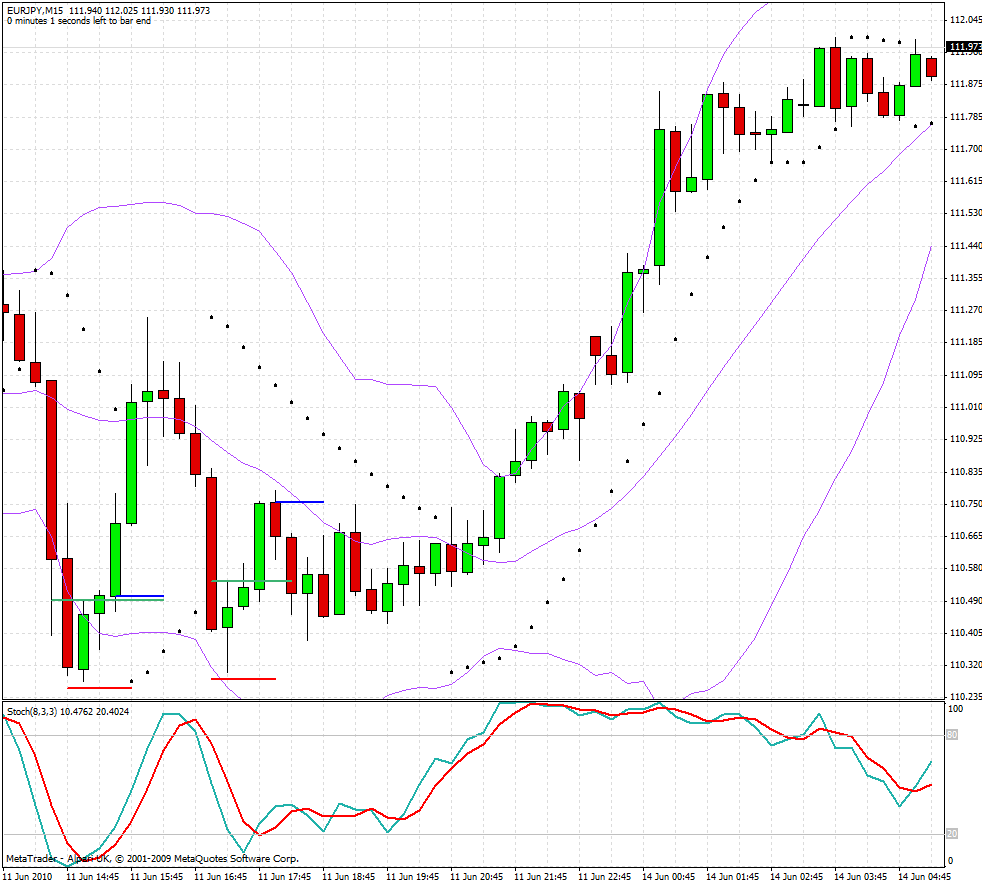
As you can see, there are 2 trades in here.

The green lines are the CBL lines, the blue lines are the entry lines and the red lines are the stop losses.

In the first instance, we get a close above the CBL line and we enter on next open. This is backed up by the the stochastic, which is moving up from the oversold region very nicely.

Remember - in trend trading, we are using the Parabolic SAR (PSAR) to set our stop loss, so this first trade (despite doing really well) only manages to break even.

In the second trade, however, if you can hold your breath long enough, the exit is much, much later, giving our accounts a healthy boost.

The final picture

Here is what we just traded:

Ok, well, that’s all there is to it!

I should probably put a disclaimer here to mention that hindsight results do not reflect future performance and will depend completely on how disciplined I am in execution.

Also…that “works 100% of the time” comment was a joke earlier…please don’t flame the author :smiley:

I already mentioned that I’ve been demo’ing this strategy over the past 2 weeks on MeetPips, so I would now like to update my BabyPips journal with the trades over the last 2 weeks.

Trade 1

USDCHF 28/06/2010 / 16:30 GMT

Counter trend - Long Trade

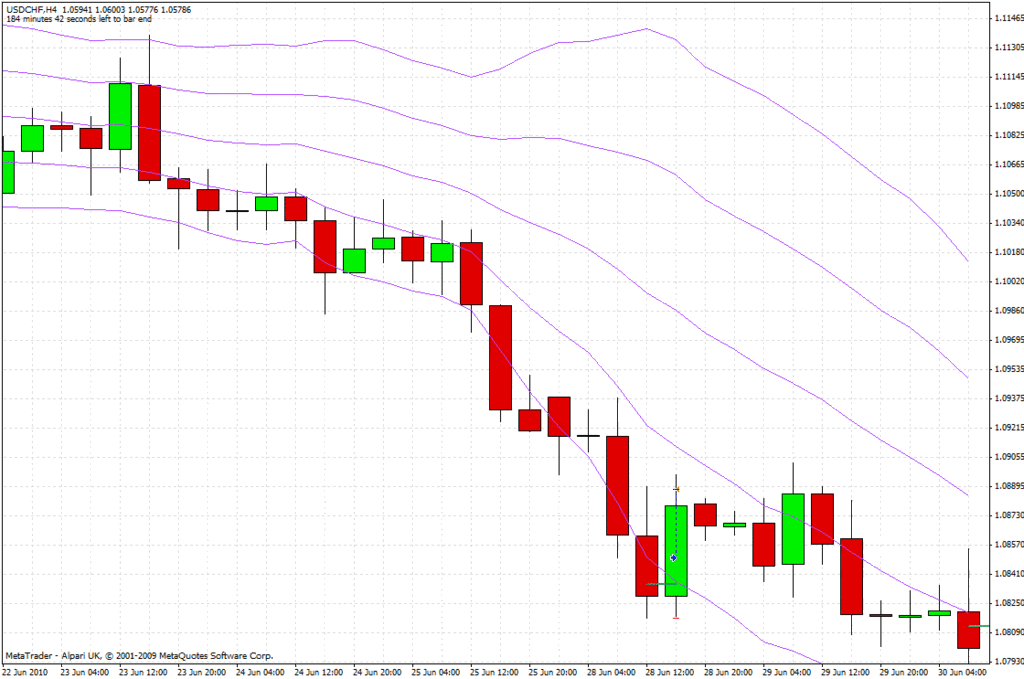
Here is the 4H time frame

I think this one may need some explanation. At the point of entry, I noticed a very slight contraction on the 4H time frame.

With that 4H contraction in mind, I dropped down to the 15M time frame and found an appropriate 15M entry…as shown below…

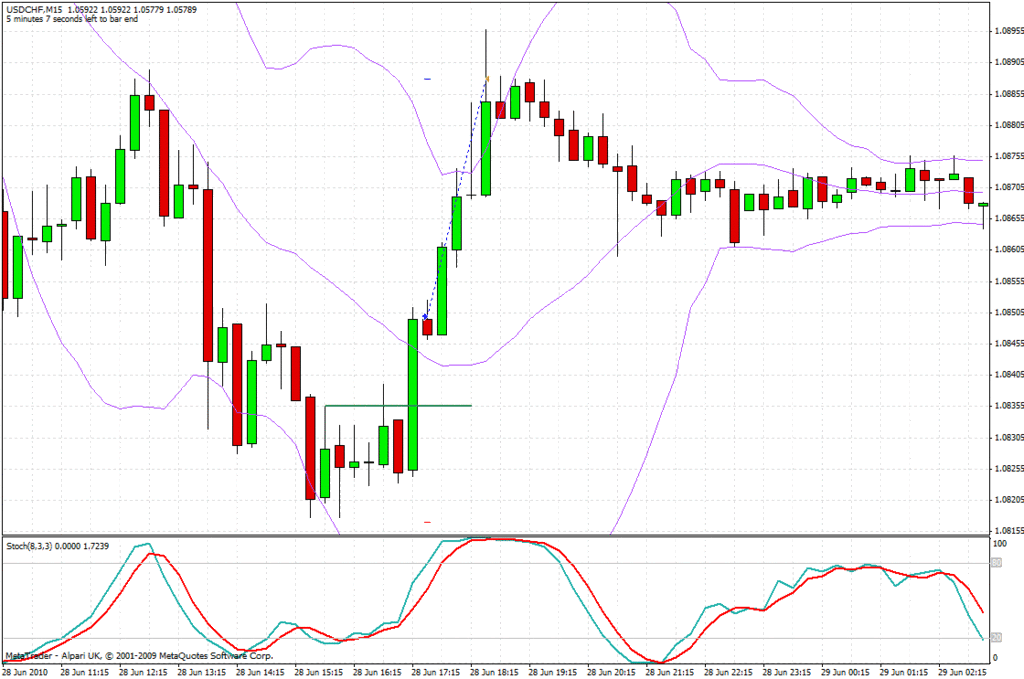
15M chart

The green CBL line is a little mis-drawn here but doesn’t do any harm, as the only entry into this trade is the close of that long green bullish candle.

With confirmation from the stochastic (although not a nice clean signal), entry was made at the open of that red retracement candle.

Trade was exited when price broke right through the upper-BB, indicating possible mean-reversion.

This is, afterall, a countertrend trade, so one needs to be very careful!

Trade Statistics

Risk = 33 pips
Reward = 38 pips
R/R = 1.15
Max profit available = 46 pips
Max R/R = 1.39
Trade Efficiency = 82.6%

End Result

+2.3%

Trade 2

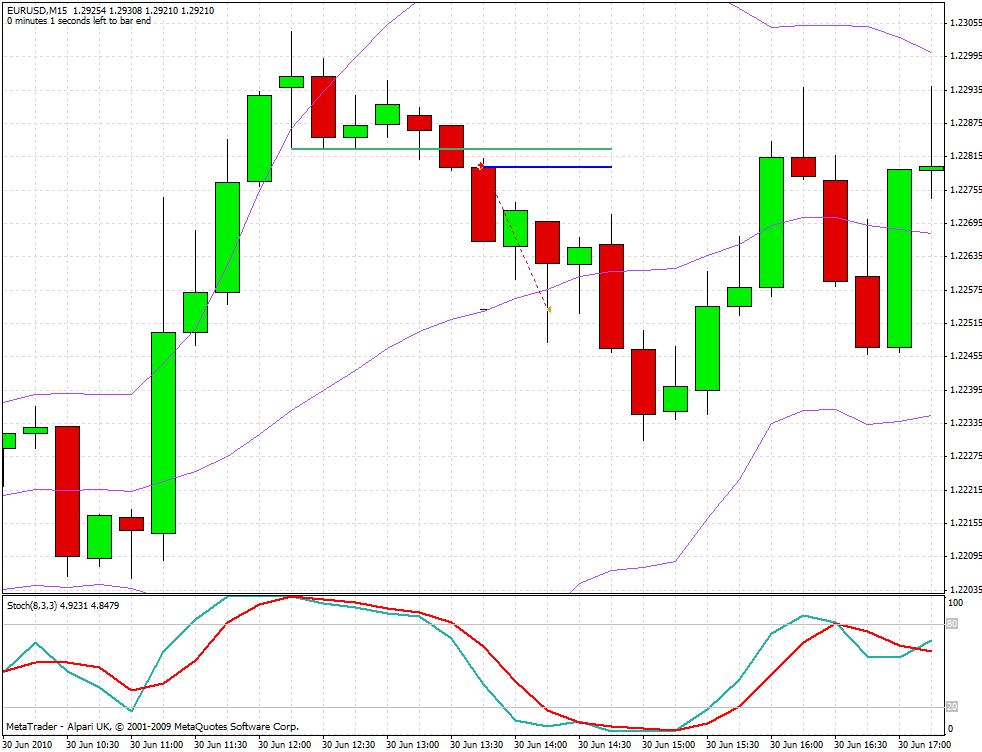
EURUSD 30/06/2010 / 12:45 GMT

With trend - ShortTrade

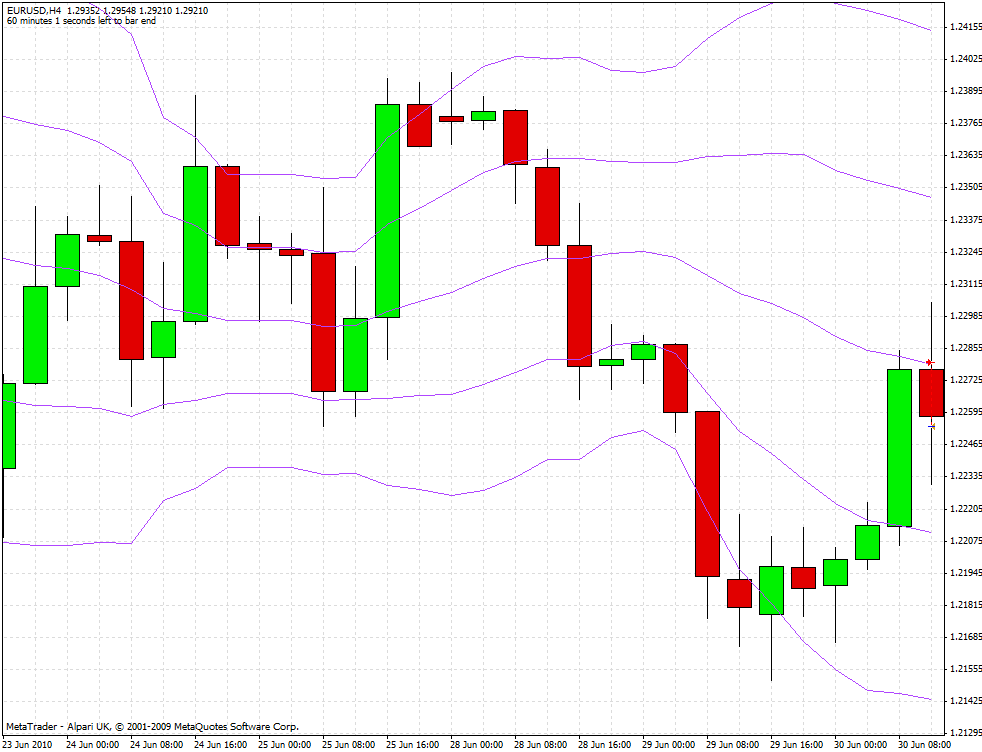
Here is the 4H time frame

The BBs tell us that price is going down - although not steeply. Notice the Mid-BB isn’t steeply going down.

I didn’t have too much confidence in this trend trade due to the nature of the BBs - but I took it anyway, with a view that I’d get out of it quickly.

15M chart

Green is our CBL, blue is my entry.

The stochastic confirms my entry.

Because of my lack of confidence in this trade, I exited early. If I had stayed in a little longer, I would have been a millionaire by now :o. Ah well.

Better trade with caution than recklessness!

Trade Statistics

Risk = 26 pips
Reward = 26 pips
R/R = 1.00
Max profit available = 49 pips
Max R/R = 1.88
Trade Efficiency = 53%

End Result

+2.0%

Trade 3

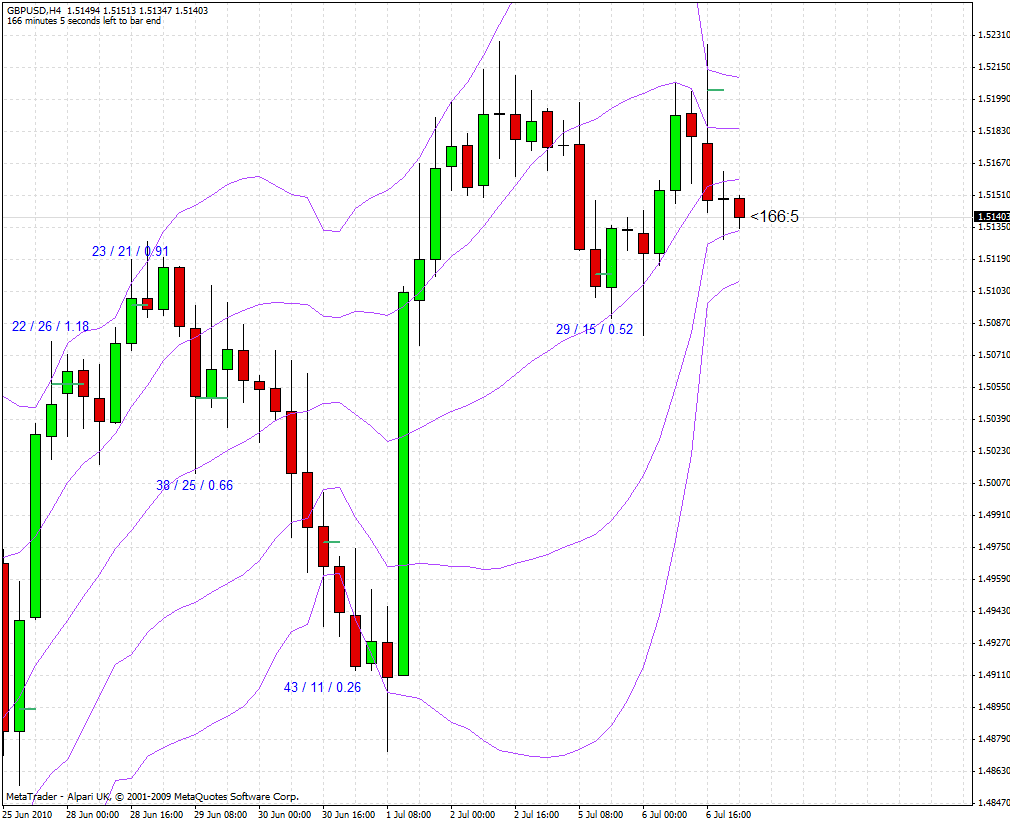
GBPUSD 06/07/2010 / 16:15 GMT

Counter Trend - ShortTrade

Here is the 4H time frame

The BBs are beginning to squeeze together. Price breaches the upper band and I begin looking for a short entry on the 15M chart.

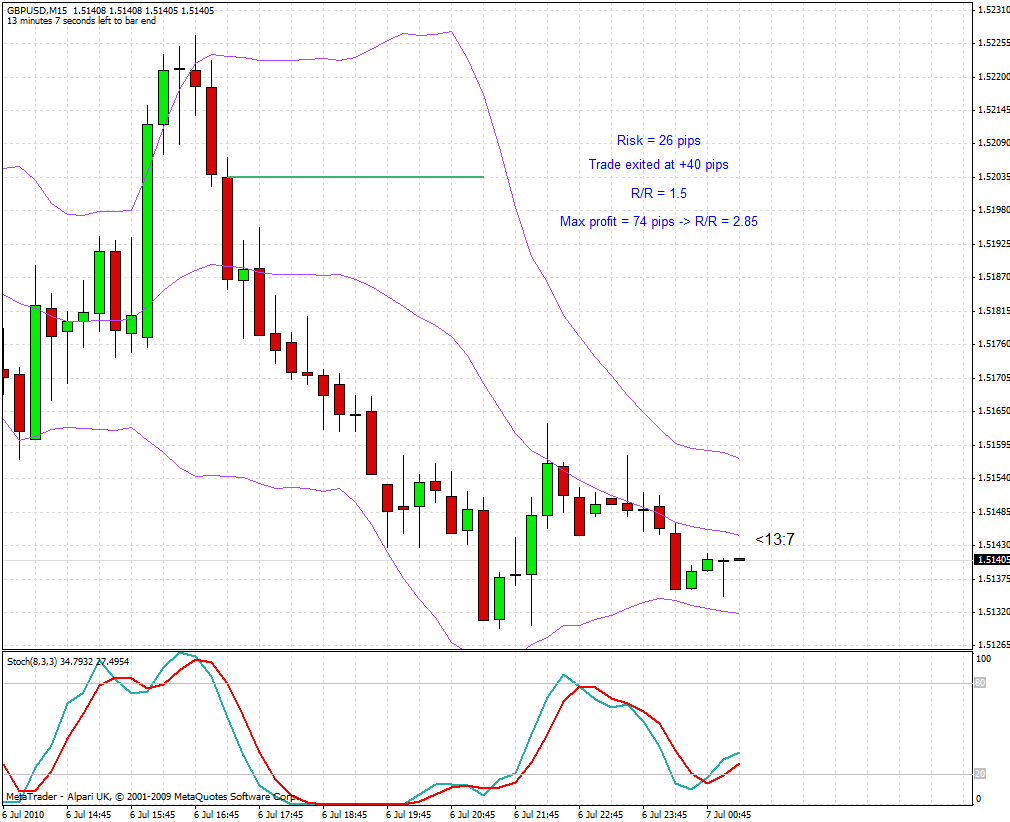
15M chart

I haven’t drawn the CBL in this case but the green line is where I entered this trade.
The CBL would have been at the low of that doji candle (that freak with no body) :smiley:

The stochastic confirms my entry.

Trade Statistics

Risk = 26 pips
Reward = 40 pips
R/R = 1.54
Max profit available = 123 pips
Max R/R = 4.73 (holy moly…)
Trade Efficiency = 33%

End Result

+3.08%

[U][B]Week 1 Results[/B][/U]

The week ended with 3 positive trades and 0 losing trades

By risking 2% per trade, the account has grown by…drumroll

[B]+7.56%[/B]

Trade 4

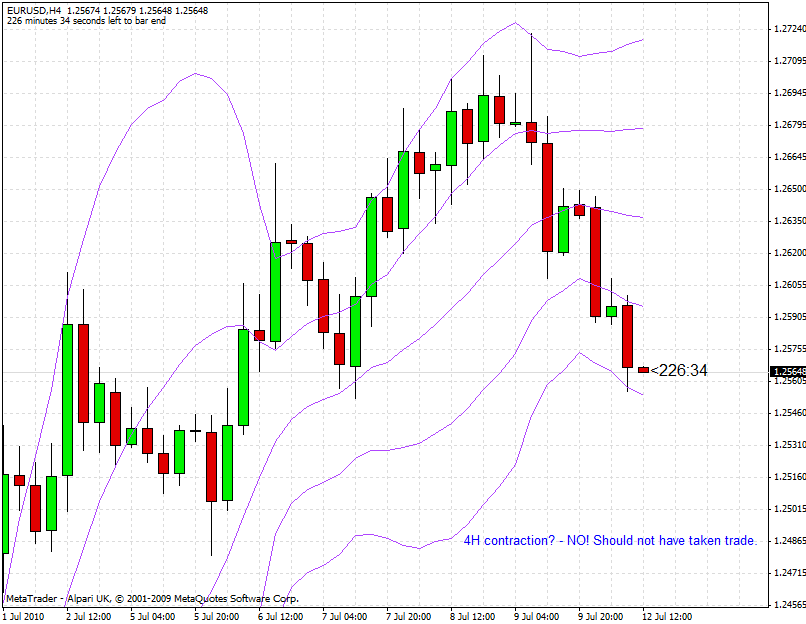
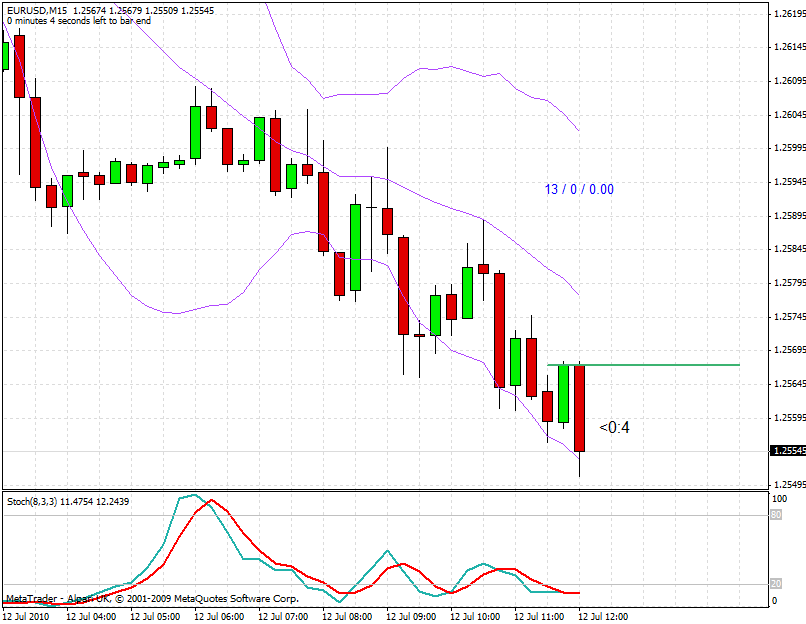
EURUSD 12/07/2010 / 11:00 GMT

Counter trend - Long Trade

Here is the 4H time frame

Could anyone please tell me if they see a trade here? Because I sure don’t see one!

I can see now the mistake I made was to enter a counter-trend trade without a contraction in the outer-BB. Maybe it was just one of those indicator re-paint things…

15M chart

The green line is where I entered this. I guess the stochastic at entry looked a lot better than what it does now…another one of those indicator repaint things…

Trade Statistics

Risk = 13 pips
Reward = 0pips
R/R = 0.00
Max profit available = 0 pips
Max R/R = 0.00
Trade Efficiency = 0.00%

End Result

-2.0%

Trade 5

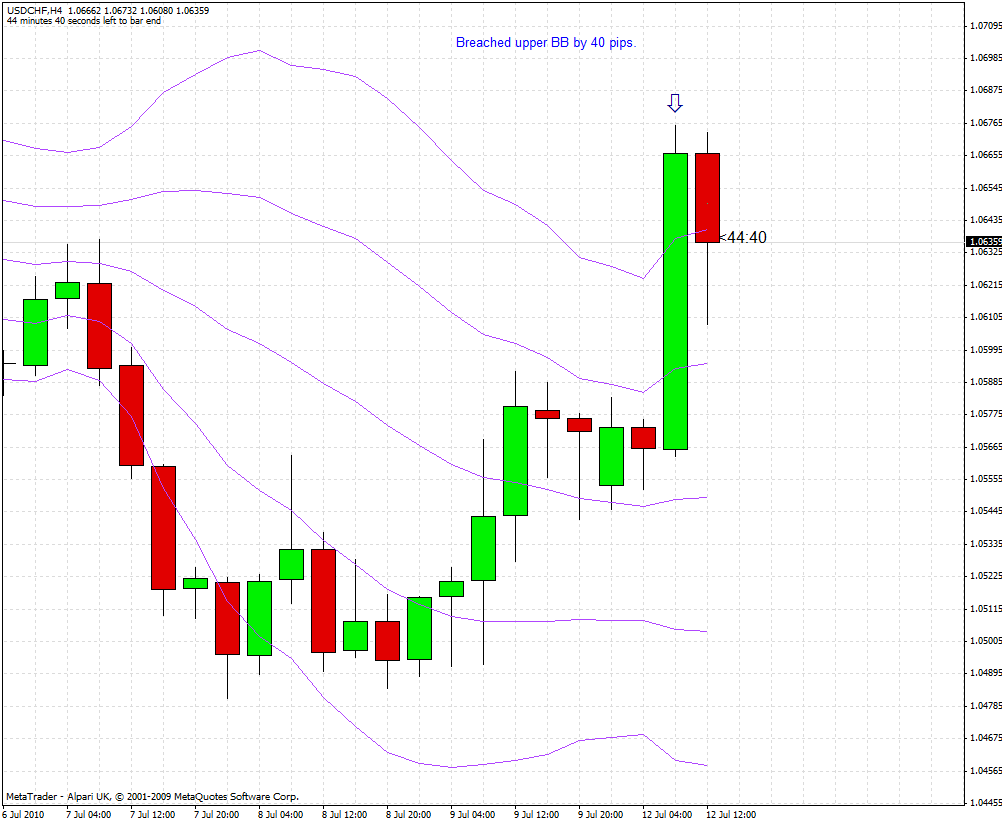
USDCHF 12/07/2010 / 11:30 GMT

Counter trend - Short Trade

Here is the 4H time frame

I thought this one was a relatively safe trade. The reason I say this is because price makes a huge move above the outer-BB and it is a large candle.

With such a long sustained trend upwards, one that’s especially well beyond the outer-BB, a retracement to below the BB is almost inevitable.

Either that or price will stall and wait for the outer-BB to catch up!

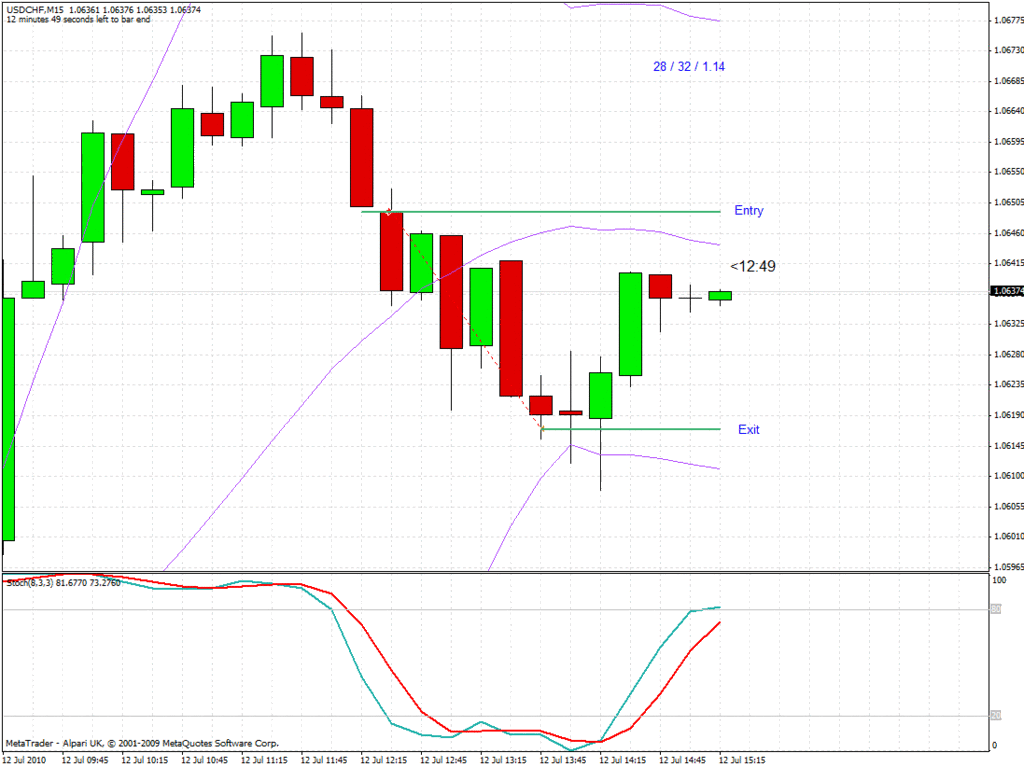
15M chart

Very much self-explanatory here. CBL is not drawn but entry and exit have been marked.

Stochastic confirms entry.

Trade Statistics

Risk = 28 pips
Reward = 32.2 pips
R/R = 1.15
Max profit available = 39 pips
Max R/R = 1.39
Trade Efficiency = 82.7%

End Result

+2.3%

[U][B]Week 2 Results[/B][/U]

The week ended with 1 positive trade and 1 losing trade.

By risking 2% per trade, the account has grown by…drumroll

[B]+0.27%[/B]

Total Account growth since inception

[B]+7.83%[/B]

[B]IronHeart![/B] This is truly a [B]fantastic journal so far - I am so pleased that you decided to post it for us to follow you along your trading journey! :)[/B] I love the way you have clearly laid out your trades and outlined your Trade Plan! This will [B]definitely[/B] be one of the threads that I look forward to reading whenever I log on to BabyPips. I also hope that your initial success is a sign of things to come!

[B]Excellent work and happy pipping![/B]

Ironheart,

It’s great to see you having success with your system. The journal is an excellent read also and I look forward to reading more!

Good luck with it, although the way you’ve been goign I’m sure you won’t need luck!

Cord

Thanks so much for your kind words [B]xXTrizzleXx[/B].

It means a great deal to me that you endorse this thread.

You truly are an icon of diplomacy - a good testament to your very own trading efforts, which I also follow with great anticipation.

I’m sure the moral support fellow traders give each other in this forum is exactly what will take us to new heights and great successes.

Even if our success doesn’t come in the form of trading, we will have formed an attitude that will aid us greatly in any endeavour for many years to come.

Ah! ol’ buddy [B]Cordite[/B]!

Thanks for checking out my thread and thanks for your encouragement.

Haven’t seen you in a while, I hope your trading is also bringing you success.

[B][U]Update[/U][/B]

During week 2, I could only trade for 1-2 days due to other commitments.

I have just had a look at the past week…and…to my shock, horror and awe…there was a HUGE potential for profit over the past week.

This gives me confidence in my strategy going forward.

Over the coming week, I probably won’t be able to trade on Monday and Tuesday. Here’s hoping for big gains on the last 3 days of the week!