TimberWolfMk2's trade journal

Greetings to all! Being rather new to the forum, one of the first threads I stumbled upon was Tymen’s excellent “The finest in trend trading”. I’d thought I knew quite a fair deal about forex, but the knowledge being shared in that thread really blew my mind. Kudos to Tymen and all others who have contributed so much and shared selflessly.

In the footsteps of many others, I will now attempt to create a trade journal documenting my trades. Note that this is my first attempt, so pls bear with me if I make any glaring mistakes!

My trading plan was created after some modifications of the DNA method and Trizzle’s trading plan. To avoid reinventing the wheel, I’ll be using the same format as Trizzle’s journal (apologies for the plagiarism Trizzle!).

The objectives of my journal are rather simple:

  1. To determine the win:loss ratio of my current trading plan and its profitability

  2. To continue modifying and evolving it as I learn from each trade I take

  3. To aid me in familiarizing of my trading plan so that execution in the future can be almost automatic & emotionless

[U]Markets[/U]

Several currency pairs are chosen to increase the probability of detecting trades:

-EUR/USD
-GBP/USD
-AUD/USD
-NZD/USD
-GBP/JPY
-EUR/JPY
-USD/JPY
-USD/CHF
-USD/CAD
-EUR/GBP
-GBP/CHF

[U]Position Sizing[/U]

2 contracts will be used for all trades. At this point, I have not yet taken into account money management as determining the win:loss % remains my priority. When I have determined this figure and deemed it acceptable, I will demo with a brand new account with proper money management, risking not more than 2% of my account for each trade.

[U]Time Frame[/U]

The 4 Hours Timeframe will be traded. This saves me time spent in front of the computer all day and lets my eyes get a break. :o

[U]Entries[/U]

I only use one set of Bollinger Bands with default standard deviation set to 2.0.

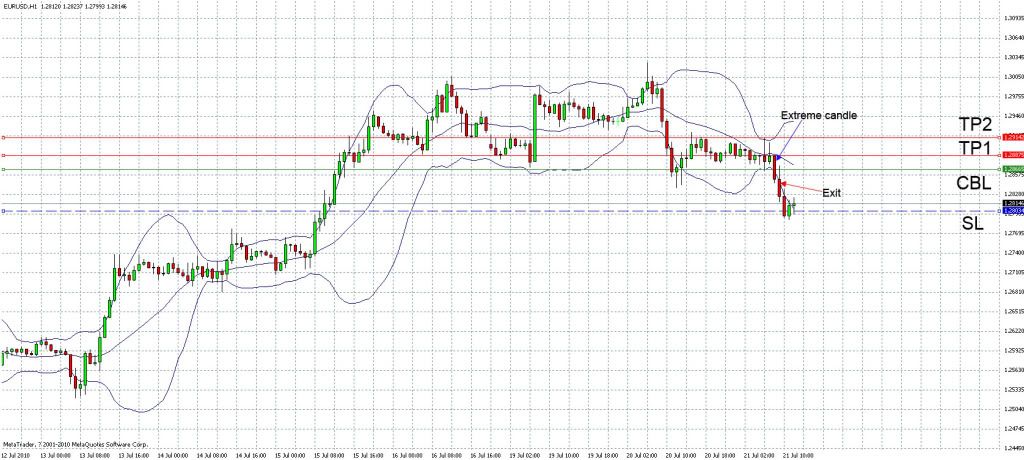
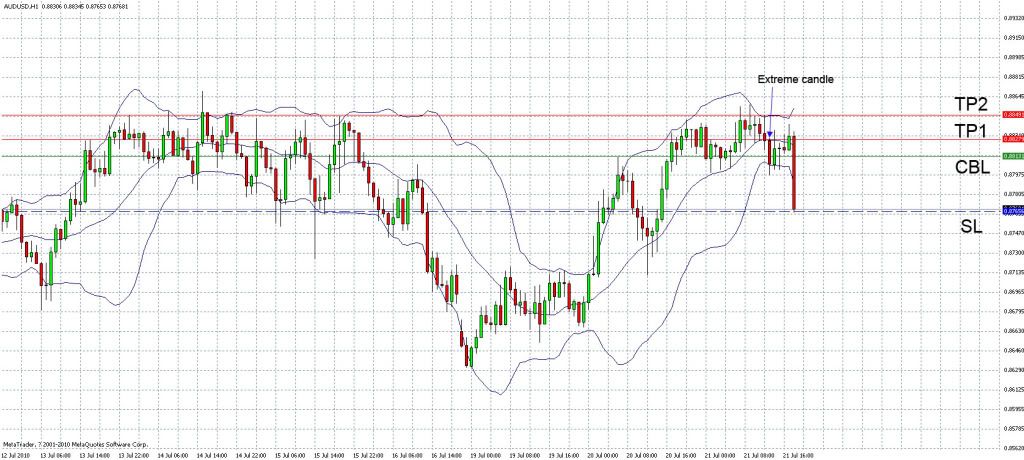
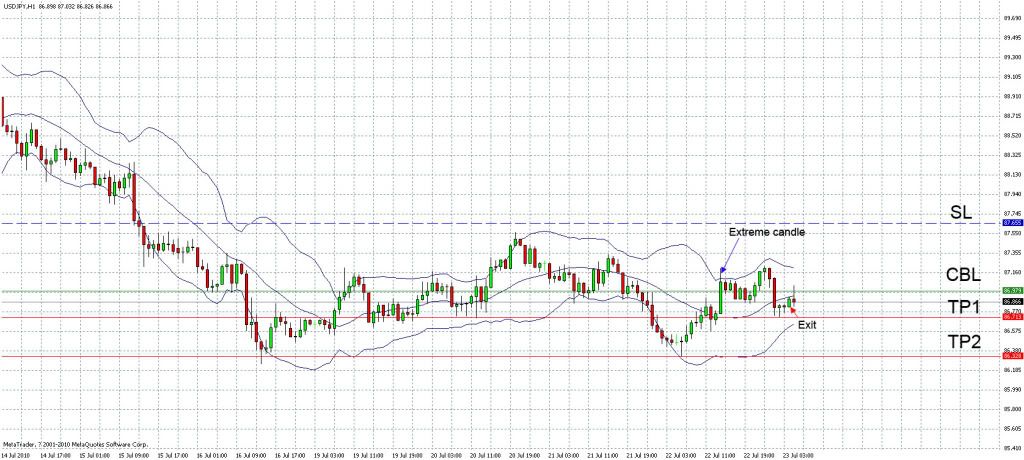
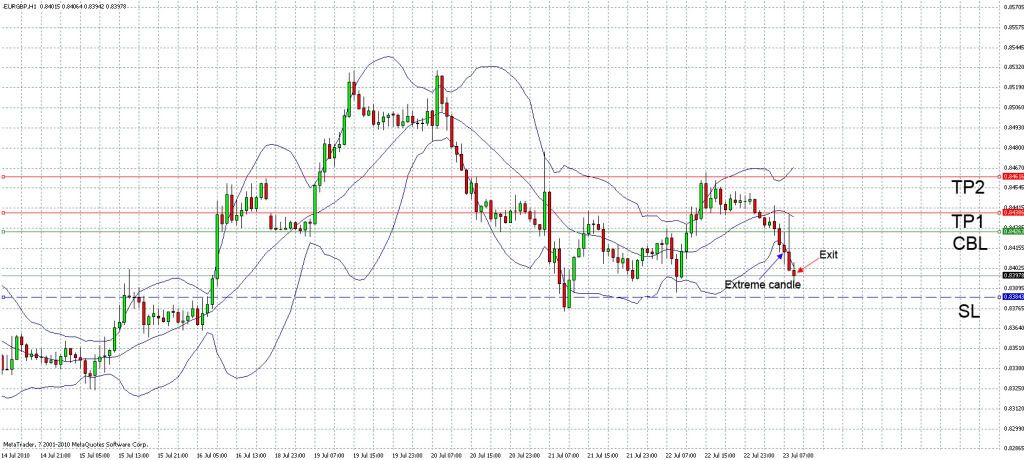
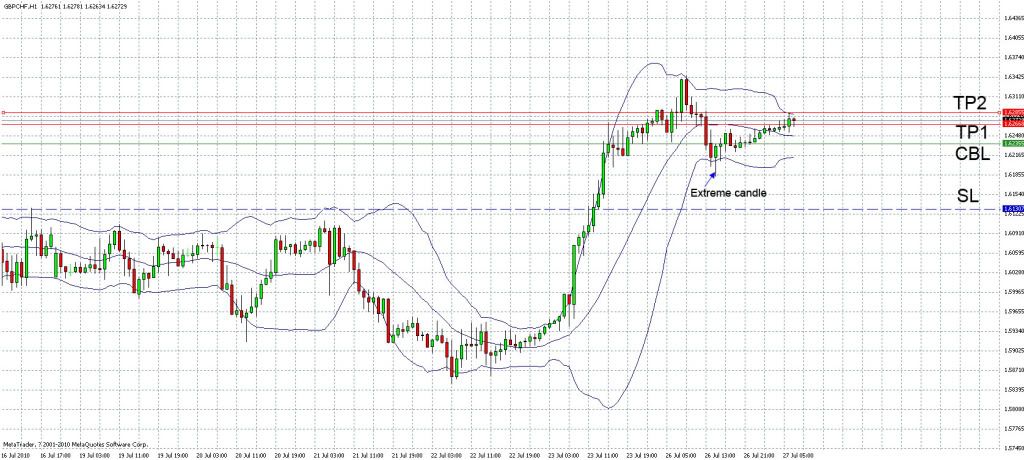
Entries will be made employing a system which uses an Orthodox Count Back Line method.

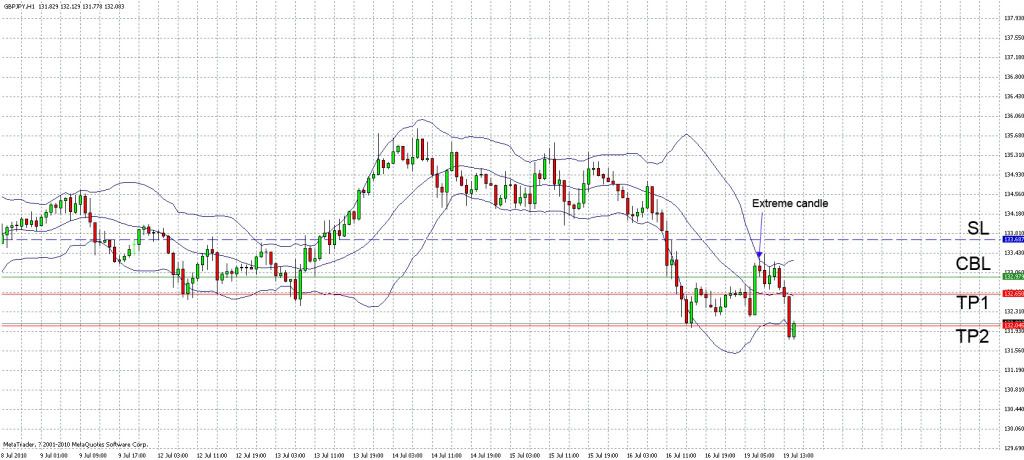
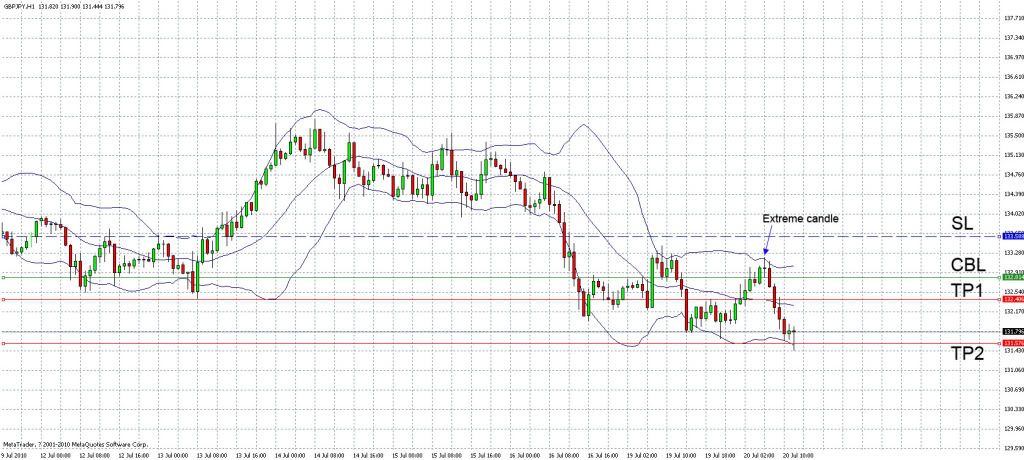
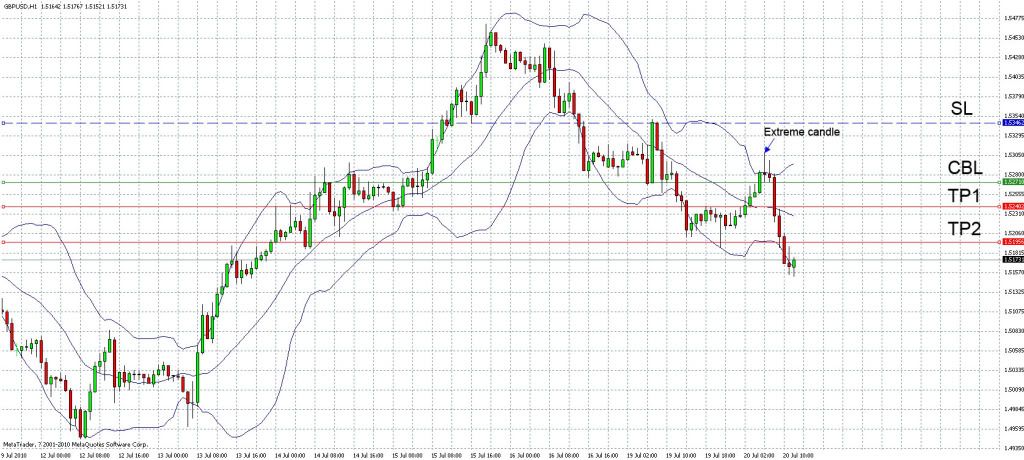
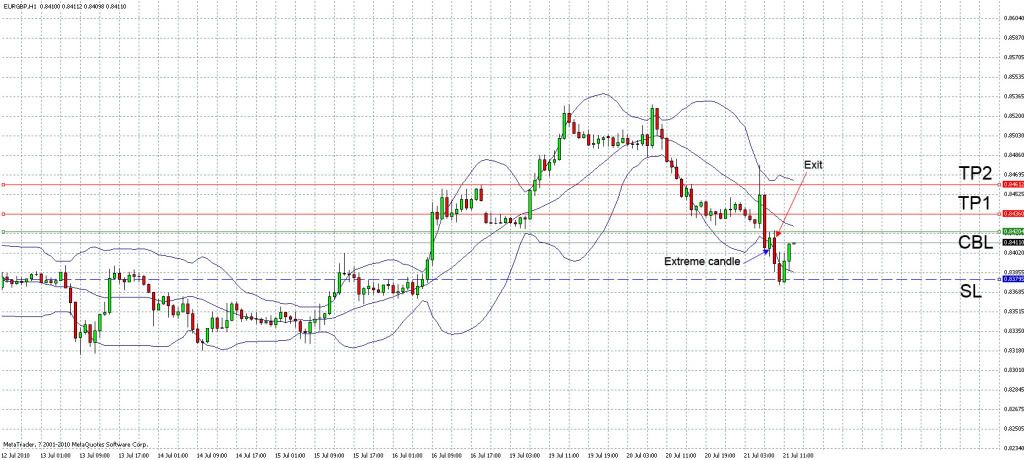
Only begin drawing the CBL from candles which touch the Outer Bollinger Band. If the CBL extends too close to the Middle Bollinger Band, then cut it in half. (I realise the definition of closeness to the middle BB is subjective since I’m only using 1 set of BB, I may look into incorporating the other in the future).

Bollinger Band bubbles and sausages will not be traded, until Point P has been reached, as they reduce the Win: Loss ratio. From my understanding, Point P is the point where the retrace of Price Action hits the opposite Outer Bollinger Band from the Outer BB the PA was walking previously.

[U]Stops[/U]

A PCI stoploss is set at 1 candle length from the extreme candle’s high/low. For example, if the extreme candle has a length of 20pips from its high to its low, the SL will be set 20pips away from the extreme candle’s high/low, depending on the direction of the trade.

A “dynamic” stop-loss (credit to Trizzle for the idea) is used should the subsequent PA close between the high/low of the extreme candle and the PCI SL. To illustrate,

Eg. For a long trade,

Extreme candle low: 100.20
Extreme candle high: 100.40
CBL: 100.40
PCI stoploss: 100.00

Should the PA after entering the trade close between 100.20 and 100.00, the trade will be exited.

Trailing Stop: Upon hitting TP1 at the middle BB, move the stop-loss to the entry position (BREAK-EVEN). As PA moves towards TP2 at the outer BB, slowly adjust the SL to the middle BB (TP1) while monitoring the movements.

If you are stopped out INITIALLY, use the candle which stopped you out as criteria for another CBL entry. If however this second entry is stopped out as well, evaluate whether or not a Bollinger Band Bubble or Sausage has formed. If it has not formed, then feel free to enter once again. If it has formed, stay out of the trade until Point P has been reached.

[U]Exits[/U]

The Middle Bollinger Band will be the site of TP1.
The Outer Bollinger Band will be the site of TP2.

When initiating the trade, set the Take Profit target immediately at the present height of the desired target Bollinger Band.

EXIT ALL TRADES BY THE MARKET CLOSE ON FRIDAY!

Hopefully I’ve not missed out anything! I’ve been demo-ing my current trading plan for the last month or so, but I’ll probably post the trades beginning from this week (since my plan had been changed slightly from the time I first started demo-ing) tomorrow. :slight_smile:

Been pretty tied up the last couple of days, hence the delay in posting… I’ll try to update my trades for the week over this weekend.

Without further ado…

19 July 2010
Pair: GBPJPY
Timeframe: 1H

2 pending orders were set for a short trade and were triggered once price action reaches CBL line at 132.98. PCI SL was set at 133.69 (1 extreme candle length) from high of extreme candle.

It took awhile before the TPs were hit. 1 contract was exited when TP1 was hit and the other at TP2. Along the way, there were a couple of minor retracements but since PA did not close above the high of the extreme candle, the trade was not exited. Also, although another better extreme candle formed after orders were triggered, the trade was not exited since the candle did not close above the high of the original extreme candle.

Total P&L = +126 pips

20 July 2010
Pair: GBPJPY
Timeframe: 1H

Same pair as the last trade. I noticed that BBs were still comparatively flat and I assumed it was still in a ‘squeeze’ area… managed to catch another bounce off the upper BB downwards. PCI SL set at 133.59 (1 extreme candle length) from the high of the extreme candle. TPs 1 and 2 were reached rather quickly, all in all a good trade. :slight_smile:

Total P&L = +163pips

20 July 2010
Pair: GBPUSD
Timeframe: 1H

I noted that area P has been reached in the chart and set up my pending orders. PCI SL was set at 1.5346 (1 extreme candle length) from high of extreme candle. Entry was set to 1.5271 and TPs were reached quite smoothly after the orders were triggered.

Total P&L = +106pips

Sweet trades TimberWolf. Good work!

I’m seeing new trading journals on this site everyday, I guess Trizzle really has had an influence on many of us!

Keep it up!

Nice work!

It appears as if you’re entries are clear concise and might i say ‘perfect’ - I am documenting my trades as well, but ONLY on the 4hr charts.

I look forward to keeping up with yours and the other journals here.

Happy Pipping to all of us!

Hey IronHeart and PerchTird, thanks for the encouragement! Its the support that we can give one another that keeps the newbies going along the journey :slight_smile:

I must agree that these couple of trades look ‘textbook perfect’, but it gets worse from here :eek:

More updates later!

Sweet trades! I’m very pleased to see your success, as well as your excellent ability to pick those very [B]clear[/B] trades as [B]PerchTird[/B] said. Looking forward to seeing your future trades. :slight_smile:

Happy pipping!

Hey Trizzle, really appreciate your kind words! Your trading journal and determination to succeed were my inspiration for starting my own. You’re always welcome in my thread! :slight_smile:

After the last couple of good trades, I’d thought that maybe I’ve found the winning formula. Then like what most people have mentioned before, the market turns around and kicks me in the nuts.

21 July 2010
Pair: EURGBP
Timeframe: 1H

Seeing that area P was reached with the candle just before the huge red one, I started looking out for a setup. BBs at that time were looking relatively flat and when the extreme candle formed, I thought it a good opportunity to enter. Same as before, pending orders for 2 contracts were set for a long trade at the entry price of 0.8420. PCI SL was set at 0.8380 (1 extreme candle length) from the low of the extreme candle. Subsequent price action reached the CBL level and triggered the trade, but then retraced again, closing below the low of the extreme candle but above SL, thus trade was exited at 0.8393.

Total P&L = -54pips (compared to -80pips had SL been hit)

21 July 2010
Pair: EURUSD
Timeframe: 1H

Same as the above. Pending orders set for 2 contracts at entry price 1.2867 (CBL set at that level by cutting the extreme candle in 2). PCI SL set at 1.2803 (1 extreme candle length) from the low of extreme candle. The next candle triggered the orders but closed below the low of the extreme candle and above SL, thus trade was exited at 1.2826 and 1.2824 for each contract respectively. I really have to watch more closely for repainting BBs :frowning:

Total P&L = -84pips (compared to -128pips had SL been hit)

22 July 2010
Pair: AUDUSD
Timeframe: 1H

As before, after noting that area P has been hit, pending orders for a long trade with 2 contracts were made. Entry price was set at 0.8813 according to the CBL by dividing the extreme candle in 2 since it was a big one. PCI SL was set at 0.8766. After the orders were triggered, TP1 was hit at 0.8828 and 1 contract was exited with +15pips. Subsequently as you can see from the huge red candle, the PA suddenly reversed and plunged, taking out the 2nd contract at SL. Til now, I’m still not sure why the massive retracement happened, hopefully someone can enlighten me on this.

Total P&L = -32pips.

22 July 2010
Pair: USDJPY
Timeframe: 1H

This was uh…a rather interesting trade. I had set up my pending orders for a short trade with entry price at 86.98 (CBL drawn by cutting extreme candle in 2). PCI SL was set at 87.66, 1 extreme candle length from the high of the extreme candle. What happened next was, after the orders were triggered, I went to bed and left the trade on overnight. The next day, I discovered that not only has my TP1 not been reached, the PA seemed to be in a uptrend (judging from the mid BB). Thankfully I was still in the green, and I exited both contracts at the market price of 86.86. I suppose the moral of the story here is not to leave your trades overnight if possible. :o

Total P&L = +24pips.

23 July 2010
Pair: EURGBP
Timeframe: 1H

Pending orders for a long trade were made after area P had been reached, with entry price at 0.8426. PCI SL set at 0.8384 (1 extreme candle length) below the low of extreme candle. Bollinger bands were almost flat upon entry, and subsequent PA moved up almost to TP1, before retracing. What happened next was I wasn’t paying attention to my trade, and when I went back to my charts I was already looking at a loss. Both contracts were exited at market price 0.8398. If I had been looking, I would have exited the minute the candle closed below the low of the extreme candle and above my SL. Lesson learnt: monitor your trades regularly when they are running.

Total P&L = -56pips

So far it has been a rather mixed bag of positive and negative trades. The things that seem to be causing the losses appear to be (1) scenarios where the PA instead of bouncing in the opposite direction after hitting area P, blasts through and continues in the previous direction (see the 23 July trade); or (2) mid way through a trade the PA reverses direction.

Granted that losses are to be expected and these scenarios are probably part of trading, I’m still scratching my head trying to figure out how I can better filter trades and optimize my strategy. I’d thought of adding indicators to get a gauge of the trend’s strength, but in Tymen’s original thread, I understand that the DNA method was supposed to be indicator-free.

Hopefully I’ll be able to come up with something in the future

Hey Timberwolf, keep at it!

Retracements just happen whether we like it or not. Looking for reasons why PA acted in one way or another is the quickest route to madness.

We just need to accept that the financial markets and hence, PA are chaotic in nature and will do anything at any time.

This is why we have to try so hard to watch our backs and control risk as much as possible.

You will do well - rock on! :cool:

Hey there TimberWolfMk2 - like IronHeart said, you are doing quite well, keep it up! Now I know it may be disheartening to see the trade retrace in the direction opposite of your trade after hitting Point P. [B]However, the beauty of it is that we control our risk[/B]. If I am stopped out after hitting the first Point P, I re-enter once more, in anticipation of a move in the original direction of my trade. I will be stopped out for -2% of my account initially, but if the trade plays out as originally, it can lead to another beautiful BB Walk, where you have [U]entered at the beginning.[/U] :smiley:

To illustrate it better, here’s a random chart. We would have entered after the BB Walk on the left hand red section, when Point P has been reached - corresponding to the [B]first yellow circle[/B]. We would have then been stopped out, but if we enter at the[B] second yellow circle[/B], we are in for a very cool ride. :slight_smile:

Hope this helps!

Happy pipping!

Thanks guys for the encouragement! No doubt the journey is tough, but its a worthwhile one to take, so yes I’ll keep pressing on.

@IronHeart: Not that I don’t realise that PA tend to defy expectations sometimes, but it really gets on my nerves when something goes wrong and I can’t figure out what the causes were. I’ve always thought that if I can’t figure out what went wrong, I can never improve on my skills or my trading plan. But you are right about the “route to madness” bit, I suppose I need to further divest my emotions when trading.

@Trizzle: thanks for the great illustration! I do attempt to re-enter upon being stopped out, but in the last week a few of my trades have consecutively been stopped out even after re-entry. What had seemed like a squeeze area after area P was hit turned out to be the prelude to a continued move in the direction against which my trades were placed. Also I’m kinda wary about setups that occur when the BBs are expanding (like the 2nd circle in your chart), since the probability of it evolving into a bubble/sausage (no trade areas) is pretty high.

26 July 2010
Pair: GBPCHF
Timeframe: 1H

Seeing that area P has been reached, pending orders for 2 contracts were set for a long trade. Entry price according to the CBL was at 1.6236, with a PCI SL below the low of the extreme candle at 1.6131. Since I took the trade rather late into the night, I had no choice but to leave it running while I get some sleep. Upon checking on it the next day, TP1 had been hit, but the BBs had contracted overnight, so TP2 was readjusted lower to the outer BB and was reached subsequently. Lesson learnt: I must stop taking trades at 12 midnight :smiley:

Total P&L = +81pips

About that retracement candle, who knows what evils lurk in the heart of the market.
But all that aside wouldn’t it have been prudent to move your second trade stop loss to b/e when the first trade closed?

Or at least up to where should you get stopped out, your p/l cancel each other out, so b/e is the result of a trade like this gone wrong?

I do believe at one time, that was part of the BB DNA strategy.

Overall, good job!