10Pip's Harmonic Trading Adventure

It all starts here, today, now. After a year of studying on and off in my spare time it is now time to start a trading journal. All trades both wins and losses will be documented here for reference.

Strategy : Harmonic Trading

Description:

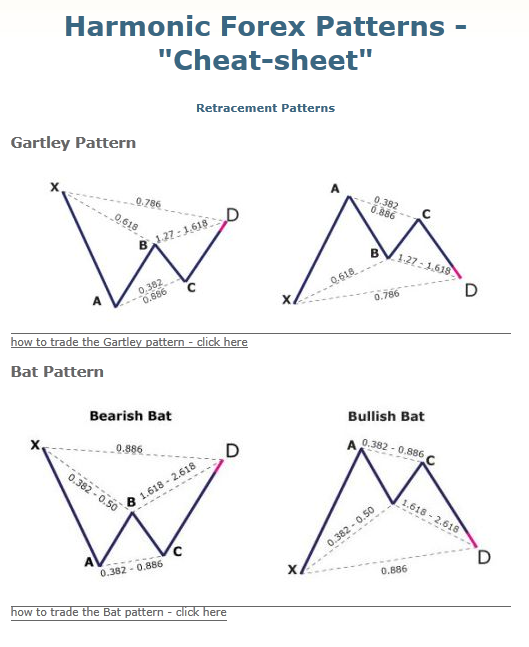
Harmonic Trading is a methodology that utilizes the recognition of specific price patterns and the alignment of exact Fibonacci ratios to determine highly probable reversal points in the financial markets. This methodology assumes that trading patterns or cycles, like many patterns and cycles in life, repeat themselves. The key is to identify these patterns, and to enter or to exit a position based upon a high degree of probability that the same historic price action will occur. Although these patterns are not 100% accurate, these situations have been historically proven. If these set-ups are identified correctly, it is possible to identify significant opportunities with a very limited risk.

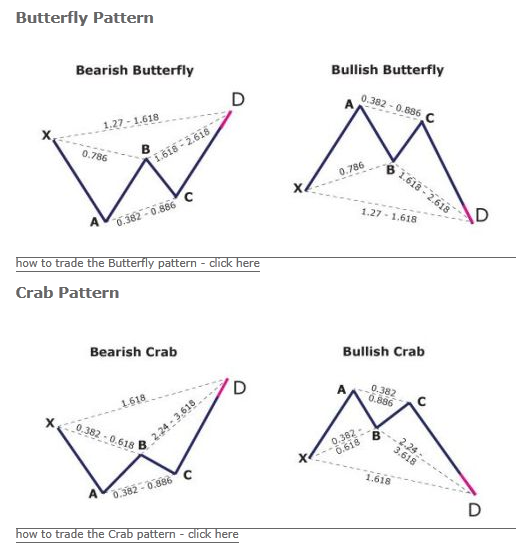
Below are the 4 harmonic patterns you’ll see throughout this thread.


Along with patterns I use one indicator as defined below

Hurst Exponent:

In harmonic trading we use the Hurst Exponent as an estimate of predictability of a price data stream. It indicates if the price action is likely to have:-

Persistence - value 0.5 - 1 (i.e. whatever is happening now is likely to continue)
Anti-persistence - value 0 - 0.5 (i.e. whatever is happening now is likely to reverse)
Randomness - value around 0.5 (i.e. likely to go in any direction)

In Harmonic Trading, when the patterns identify possible reversal trades, the Hurst Exponent should ideally be between 0 and 0.5. (Note this is true regardless of a bullish or bearish trade). The lower and steeper the Hurst Exponent is, the better it is.

I use Hurst just as a filter to help me determine how heavy or light I should take the trade - not to influence if I take the trade or not.

Goals:

Trade a $2,300 demo account to $5,000.
Build confidence in my trading ability.
Define every step of a trade to almost mechanical execution.
Learn how tax is handled with spot forex in the usa.
Consistently win more then I lose.
Start trading live with confidence.

Helpful links:

30 pips a day keeps your money at bay Great source of harmonic trading information here at babypips.com.

At times I may post unrelated trade setups. This helps clear the mind, stay on track, among other things keep it fun.

Fibonocci Ratios

Some of the fib ratios found here maybe unfamiliar to you here they are.

[B][U]Primary Ratios:[/U][/B]
(Directly derived from the Fibonacci Number Sequence)
0.618 = Primary Ratio
1.618 = Primary Ratio

[B][U]Primary Derived Ratios:[/U][/B]
0.786 = Square root of 0.618
0.886 = Fourth root of 0.618 or square root of 0.786
1.13 = Fourth root of 1.618 or square root of 1.27
1.27 = Square root of 1.618

[B][U]Complementary Derived Ratios:[/U][/B]
0.382 = 1-0.618
0.50
0.707 = Square root of 0.50
1.41 = Square root of 2.0
2.0 = 1 + 1
2.24 = Square root of 5
2.618
3.14 = Pi
3.618 = 1 + 2.618

These are exactly as found in Scott Carney’s book - Harmonic Trading Profiting From The Natural Order of The Financial Markets.

Last but not least is the harmonic indicator itself.

[B][U]Korharmonics:[/U][/B]
It automatically looks and presents (real-time and history) harmonic and price patterns appearing on any market (forex, stocks, indexes, commodites) and instrument supported by MT4. For the user/investor it means: possibility to monitor multiple markets, instruments, timeframes possibility to define set of favorite patterns to look for assurance that each pattern will be spotted and the user alerted at the end spending less time looking at the monitor, but not missing an opportunity.

This is only used to know when a possible pattern is starting. After a signal all fibonacci measurements are checked manually, Price Reversal Zone is defined manually, and price projections defined manually.

This is a great tool have it can really help find good harmonic patterns as long as you know how to check for validity. A simple google search will provide you with where to find it. I can not give it to you.

Here I will post ideal or perfect conditions for each pattern as stated in Scott Carney’s Books.

[B][U]The Perfect Gartley:[/U][/B]

  1. 0.618 B point retracement of XA.
  2. 0.786 D point retracement of XA.
  3. 1.618 projection of BC leg.
  4. Equivalent AB=CD pattern 0.618 - 1.618 with distinct symmetry and time duration for each leg.
  5. C point at 0.618 retracement.

[B][U]The Perfect Butterfly [/U][/B]

  1. Exact 0.786 B point retracement of XA leg.
  2. 1.27 XA projection exclusively.
  3. 1.618 BC projection.
  4. Alternate 1.27 AB=CD in PRZ. (Price Reversal Zone)
  5. C point within a range of 0.50 to 0.886 retracement.

[B][U]The Perfect Crab[/U][/B]

  1. Precise 0.618 B point retracement of XA.
  2. 3.14 BC projection.
  3. 1.618 AB=CD.
  4. C point within range 0.50 - 0.618.

[B][U]The Perfect Bat[/U][/B]

  1. 0.50 B point retracement of XA leg.
  2. 0.886 D point retracement of XA leg.
  3. 2.0 BC projection.
  4. Alternate 1.27 AB=CD pattern required.
  5. C point Should be in the 0.50 - 0.618 range.

Remember these are perfect condition requirements and should be treated as such. Most of the time patterns are not “perfect”.

[B][U]Trading Checklist[/U][/B]

  1. Is there a pattern?

  2. What is it?

  3. Is there an AB=CD?

  4. Where does it complete?

  5. Are there 3 or more fib levels converging in the price reversal zone?

  6. What are they?

  7. What are the time cycles (symmetry) suggesting?

  8. Are there any warning signs?

  9. At what point is the PRZ no longer valid? (stop)

10 How much must I risk? Am I willing to risk it?

The first pattern this dreary Friday morning is a perfect 15M bat pattern. All conditions are met exact 0.50 B point retracement, D point candle closed just below the 0.886 of XA, and 2.0 BC was close to 0.886 as well. Price fully tested the PRZ. In addition to all conditions being met the 1H charts show price is at a key resistance level with double tops.

Below I try to explain everything on the chart. With fibs still on there for explanation it looks quite cluttered. After checking all fib level’s I remove most of the clutter. However it should be easy to understand what everything is just check the notes.

This pattern could fail and turn into a butterfly.

Edit:
Forgot stop details
10 pips above the previous high.

Edit:
What a busy day quite a few (5ish) patterns have shown I’ve decided not to enter any more considering the time instead another lot was added to NZD/JPY after price rallied a little further.

Last Edit:
Everything was going well on till a quick 30 pip jump up. I could have easily taking a small profit which is what my gut was saying because of how price was acting. This may not be the best way to start a journal but it does show losing is a real part of trading. Total draw down about 2%. That’s it for this week. Have a good weekend all.

Good morning traders.

Here we have a great example of why I do not rely on the software to provide accurate signals all the time. This emerging butterfly shows up on the 30M, 1H, 4H and Daily charts so when we get to the PRZ I defined a reversal should happen.

White fibs X to A Leg.
Blue fibs B to C leg.
PRZ marked in light and dark green lines.
1.27 of XA leg the highest price point.
Lowest price point is 1.618 of BC leg.

Here’s the soon to be butterfly I was talking about in the previous post.

Here we have another butterfly pattern. The indicator removed it from the charts for what ever reason. So I drew in the lines with jing. This was a quick 15M scalp for +0.5% of the account. Upper green line is 1.27 XA fib lower is 1.618 of BC.

As you can see price went down fast then reversed this is why I don’t trade 15M time frame vary often.

Interesting stuff, care to share your Hurst Exponent indicator? :smiley:

I’m on board and wish you the best of luck, and I look forward to reading your posts, 10pips.

Have you found out why the XABC legs are long/short the way they are?

Sure, I’d be glad to it’s called iVar.mq4 download below.

Thanks for the support.

I do not understand your question… Each leg is based on a psychological price movement supporting a specific D point where you would either buy or sell. Hope that helps.

iVAR.zip (1.47 KB)

Thank you very much.

By the way I had a look at the KorHarmonics indicator and I don’t know if it’s much good. It seems to repaint A LOT and even removes patterns which “don’t work out”. It also doesn’t take time into account either. I’m sure it can be used to some effect, especically as you said you’re going to manually check the pattern yourself anyway, but most of the patterns it puts up aren’t even close to ideal patterns either (although you can switch on perfect patterns only). Personally I think ZUP works a bit better.

Just a word of warning, but you probably have more knowledge/experience with the indicator and harmonic patterns than me anyway. Best of luck. :slight_smile:

Always glad to help shroom your vary welcome. TBH I don’t like Kor or zup but I do like kor more then zup (if that make sense) because it shows most of the patterns known including AB=CD. Zup only focuses on a few if memory recalls. A lot of people say repainting is a problem but it really isn’t if you check the fib levels and define a prz instead of following kor’s prz. Neither are as good as a certain paid indicator/subscription which i wont say here because it would probably sound to promotional. Though I do intend to switch to the paid one for going live. Much more patterns shown with better accuracy.

That’s a fair point, ZUP is pretty limited in the patterns it shows up. I can’t wait to see if you can nail this technique.

I have a question though, as finding the perfect pattern is very rare how you differentiate between patterns you should take and those you shouldn’t? Is there a rough percentage that a pattern can be within or confirmation with other s/r levels, etc? I noticed that the Kor indicator flashed up lots of imperfect patterns, some of which worked out and some of which didn’t. I personally couldn’t see anything to suggest why some failed and some suceeded, can you point me in the right direction?

Filtering patterns can be vary subjective.

The stats are for 1H and 30M time frames.

  1. Only trade a pattern if it has ideal or perfect fib ratio’s. These happen more then one would think. Price does not need to touch the specific fib line either. Tmoneybags stated that as long as price was within 10 pips of a fib it would still be valid. I’m a little more lenient with a 15-20 pip buffer.

  2. Watch price action as it enters the PRZ two TF’s lower then the pattern formed on. For example if a gartley forms on the 1H TF watch the 15M chart for slowing or consolidation.

Something I’ve noticed is most of the time when a pattern fails it does indeed revers slightly 25-50ish pips. Depending on the time frame. This maybe why Tmoneybags had a goal of 30 pips per trade.

We have a nice Gartley forming on EUR/GBP 1H and 30M charts.
I have orders set for
1.27 of BC
1.27 of AB=CD
0.786 XA

With a stop loss just outside the PRZ. I do not think price will get to 786 of XA because of previous support. Depending on where the reversal happens 25-60 pips is the goal.

Edit:

Reversal occurred a few pips before my first limit. Canceled orders.

Another Gartley trade on the USD/CAD.

Opened a trade right in the middle of green lines (PRZ).

Edit:
Crazy market today… Price has been bouncing around in a 10 pip range for 30 min about 10 pips below my entry. Good signal :slight_smile: I hope. This is a classic case of watching the charts when I shouldn’t. Really need to not do this.

Edit 2:
Looks more like a double bottom now.

Edit 3: Stop set for 1.0080

Update added the last information installment on page one called Trading Checklist

I haven’t been following these rules lately. Not all of them anyways. Sticking to this list will help me both filter and confirm trades easier.

Edit: Set take profit for only a few pips on previous trade. I’m done for the week.