[B]FxGrow Daily Technical Analysis – 11th Jan, 2015[/B]
[I]By FxGrow Research & Analysis Team[/I]
[B]AUDUSD - dynamic rebound from the support[/B]
Since the beginning of this year AUDUSD falls and broke few supports. For 6 sessions there was lower highs and lower lows and this downtrend stopped today, when first dynamic rebound occurred. Rebound was caused by support which was created by September’s lows at area 0.6920. Temporarily rebound was stopped by 0.7020 level, but after its breakout next resistances are at levels: 0.7080, 0.7160, 0.7280.

[B]Wider view, time-frame W1[/B]
Since 2011 AUDUSD moves in downtrend. However last 5 months is a side movement between levels: 0.6920 - 0.7370. It is more likely that in long time trend will be continued and price will fall below 0.6920. While price is between pointed levels it is a side trend and traders should trade from band to band.

[B][I]For more in depth Research & Analysis please visit FxGrow.[/I][/B]
[I][B]Note:[/B] This analysis is intended to provide general information and does not constitute the provision of INVESTMENT ADVICE. Investors should, before acting on this information, consider the appropriateness of this information having regard to their personal objectives, financial situation or needs. We recommend investors obtain investment advice specific to their situation before making any financial investment decision.[/I]
[B]FxGrow Daily Technical Analysis – 12th Jan, 2015[/B]
[I]By FxGrow Research & Analysis Team[/I]
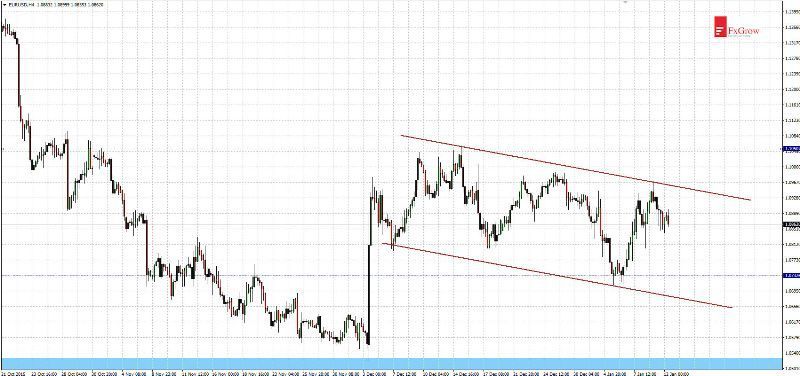
[B]EURUSD - movement in downward channel suggest the direction of breakout[/B]
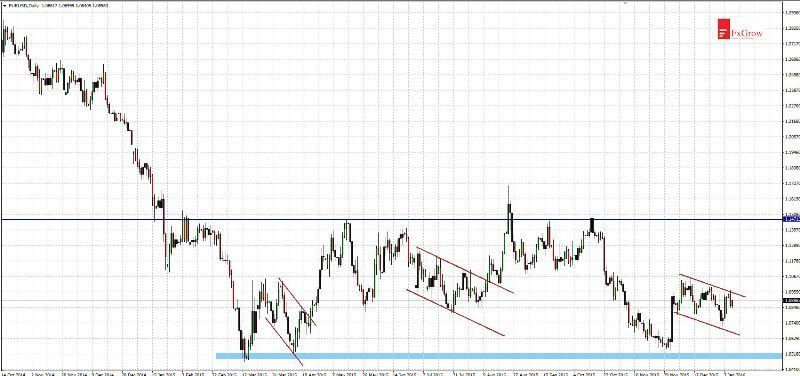
Since December 4 EURUSD moves in downward channel between 1.0720 - 1.1050. Fundamentally dollar should strengthened and EURUSD continue its declines but it doesn’t. It indicates, that any dovish information from FED could induce upward movement at least to 1.1050. Similar channels formed several times in the last few months (as you can see in the chart D1) and every time breakout was in direction opposed to the channel slope. If price breaks the channel, further movement will be also in consolidation but in a bigger one, between levels: 1.0500 - 1.1500.
[B]Time-frame H4[/B]
[B]Time-frame D1[/B]
[B][I]For more in depth Research & Analysis please visit FxGrow.[/I][/B]
[I][B]Note:[/B] This analysis is intended to provide general information and does not constitute the provision of INVESTMENT ADVICE. Investors should, before acting on this information, consider the appropriateness of this information having regard to their personal objectives, financial situation or needs. We recommend investors obtain investment advice specific to their situation before making any financial investment decision.[/I]
[B]FxGrow Daily Technical Analysis – 12th Jan, 2015[/B]
[I]By FxGrow Research & Analysis Team[/I]
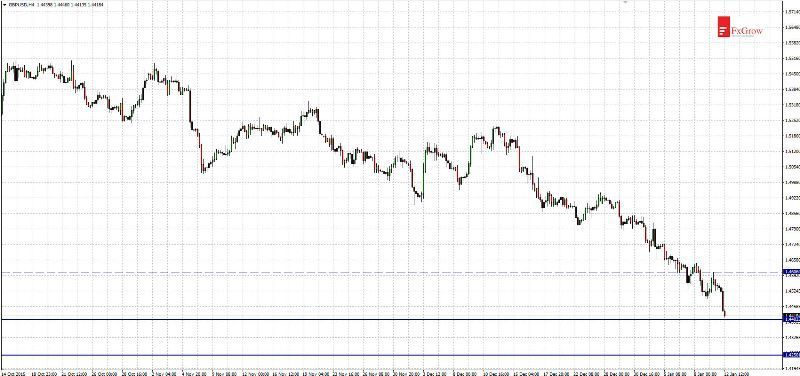
[B]GBPUSD - lowest since mid-2010[/B]
Currently we have very clear situation at GBPUSD. After support breakout (1.4600) price tested it from the bottom. Reversing the polarity was confirmed and last support has become new resistance which is clearly visible in the chart below. Demand couldn’t go back even for a moment above 1.4600. Further target for falls could be one of supports from 2010: 1.4400 or 1.4250. If price falls below them it is almost certain that price will reach below 1.4000 level.
Attention should be paid to the GBPUSD nearest Thursday when the central bank of England publish its decision on interest rates. A likely scenario is a test of one of the indicated levels and rebound on Thursday’s BoE decision.
[B][I]For more in depth Research & Analysis please visit FxGrow.[/I][/B]
[I][B]Note:[/B] This analysis is intended to provide general information and does not constitute the provision of INVESTMENT ADVICE. Investors should, before acting on this information, consider the appropriateness of this information having regard to their personal objectives, financial situation or needs. We recommend investors obtain investment advice specific to their situation before making any financial investment decision.[/I]
[B]FxGrow Daily Technical Analysis – 13th Jan, 2015[/B]
[I]By FxGrow Research & Analysis Team[/I]
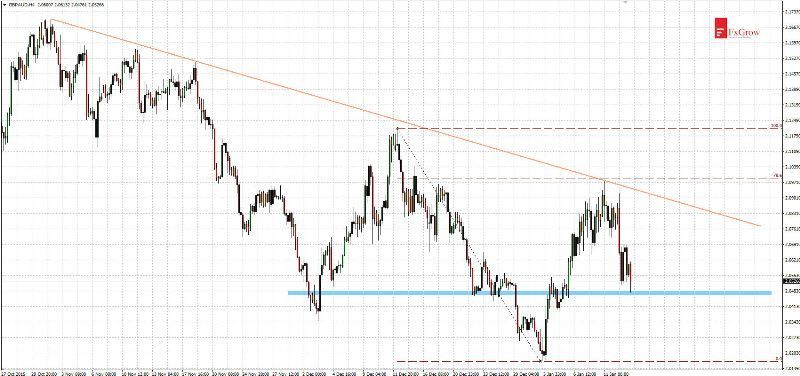
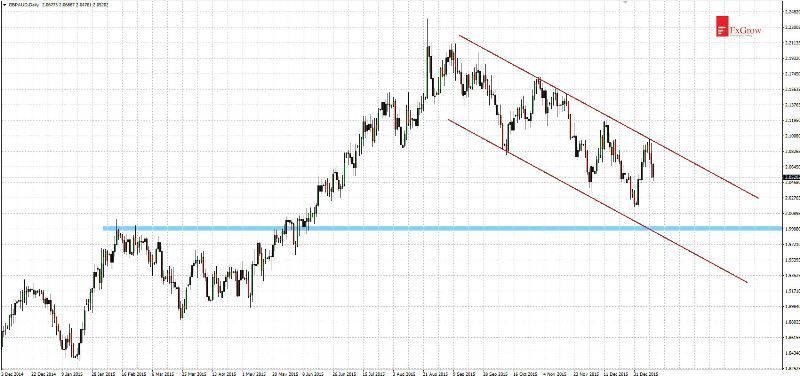
[B]GBPAUD - movement in downtrend channel[/B]
Since last year’s August GBPAUD moves in a downtrend. Previous wave of declines finished at 2.0170 (almost 7-months low) and rebound occurred. Price was gaining until Monday when after reaching a downtrend line (coinciding with Fibonacci 78,6%) new wave of falls occurred. Today downward movement is continued, but declines are paused by support 2.0470. There is no sign that this support should stop declines. It is very likely that after its breakout, lower limit of downward channel will be tested. Currently that lower limit coincides with strong support 1.9900. However if bulls strengthens, the trend reversal momentum will try to close the price above 2.1000 level. This would mean break above: downtrend line (time-frame H4) and downtrend channel (time-frame D1).
[B]Time-frame H4[/B]
[B]Time-frame D1[/B]
[B][I]For more in depth Research & Analysis please visit FxGrow.[/I][/B]
[I][B]Note:[/B] This analysis is intended to provide general information and does not constitute the provision of INVESTMENT ADVICE. Investors should, before acting on this information, consider the appropriateness of this information having regard to their personal objectives, financial situation or needs. We recommend investors obtain investment advice specific to their situation before making any financial investment decision.[/I]
[B]FxGrow Daily Technical Analysis – 13th Jan, 2015[/B]
[I]By FxGrow Research & Analysis Team[/I]
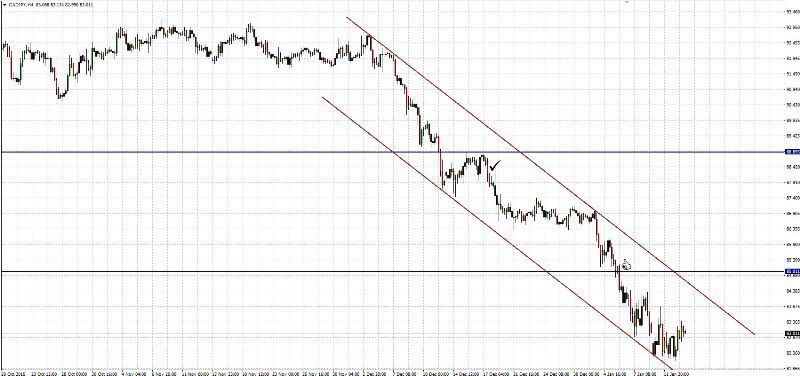
[B]CADJPY - closer to stronger support zone[/B]
Analysis from December 17 was very profitable. However declines without any correction reached much lower than I expected (black symbols at H4 chart). I wrote: “Current situation looks very bad for demand side. Upward movement which we saw this week was just a re-test of new resistance. It is likely that declines will become a further direction”, “The nearest support can be found at: 87.40, and another in the area 85.00”.
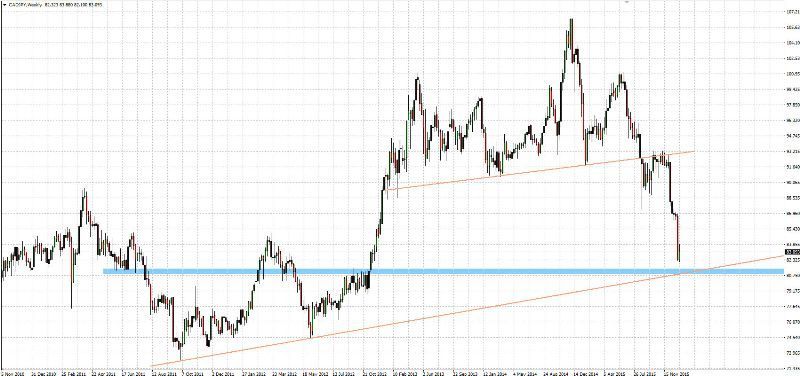
Downtrend is so strong that support at 85.00 didn’t stop declines even for one day. Currently lower limit of downtrend channel was tested and weak rebound may occur, however it shouldn’t reach higher than 84.70. Strong support is near 81.00 area and there should be a rebound. Price many times reacted at this level between 2010 – 2012. However if bulls strengthen first break above 85.00 level will be a first signal for a trend reversal.
[B]Time-frame H4[/B]
[B]Time-frame W1[/B]
[B][I]For more in depth Research & Analysis please visit FxGrow.[/I][/B]
[I][B]Note:[/B] This analysis is intended to provide general information and does not constitute the provision of INVESTMENT ADVICE. Investors should, before acting on this information, consider the appropriateness of this information having regard to their personal objectives, financial situation or needs. We recommend investors obtain investment advice specific to their situation before making any financial investment decision.[/I]
[B]FxGrow Daily Technical Analysis – 14th Jan, 2015[/B]
[I]By FxGrow Research & Analysis Team[/I]
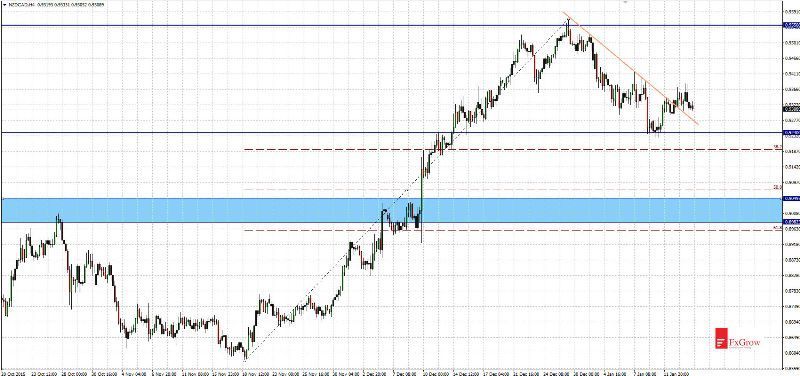
[B]NZDCAD - it’s not the end of correction[/B]
After upward movement lasting 2 months NZDCAD reached resistance, which since 2014 has been causing rebounds. That’s also happened now. For the third time area 0.9550 stopped bulls charge. Falls that occurred doesn’t reach even to Fibonacci 38,2% which could mean that correction isn’t finish.
Bulls could try to return to uptrend as evidenced by broken intraday downtrend line (orange line at the chart). However it shouldn’t be succeeded (December’s high shouldn’t be threatened). If bulls fail, price will come back to correction. When bears return and support at 0.9240 will be broken, it is likely that next target will be found near 0.9000 - 0.9050. At this area supports coincide with Fibonacci levels. Nearest resistances: 0.9380, 0.9470, 0.9550. Nearest supports: 0.9240, 0.9110, area 0.9000-0.9050.
[B]Time-frame H4[/B]
[B][I]For more in depth Research & Analysis please visit FxGrow.[/I][/B]
[I][B]Note:[/B] This analysis is intended to provide general information and does not constitute the provision of INVESTMENT ADVICE. Investors should, before acting on this information, consider the appropriateness of this information having regard to their personal objectives, financial situation or needs. We recommend investors obtain investment advice specific to their situation before making any financial investment decision.[/I]
[B]FxGrow Daily Technical Analysis – 14th Jan, 2015[/B]
[I]By FxGrow Research & Analysis Team[/I]
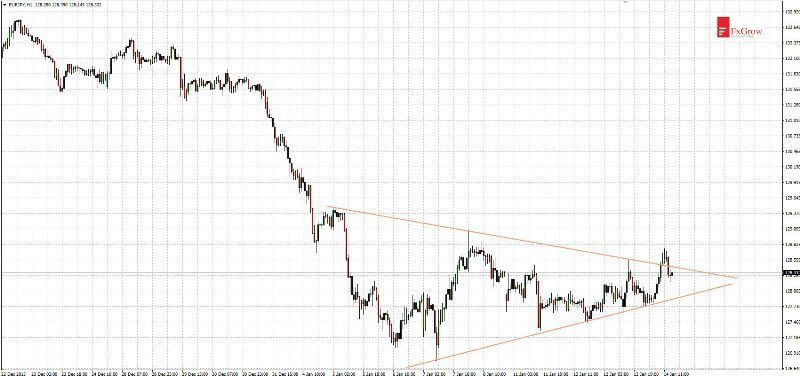
[B]EURJPY - failed attempt of break above triangle upper limit[/B]
In January there is a side trend at EURJPY and price formed triangle pattern. Today bulls tried to broke above upper limit of the triangle but they failed. Successful breakout could be very dynamic. If it is up, upward movement will be limited to 133.00. However if it is down, it will give a strong long-term trend reversal signal.
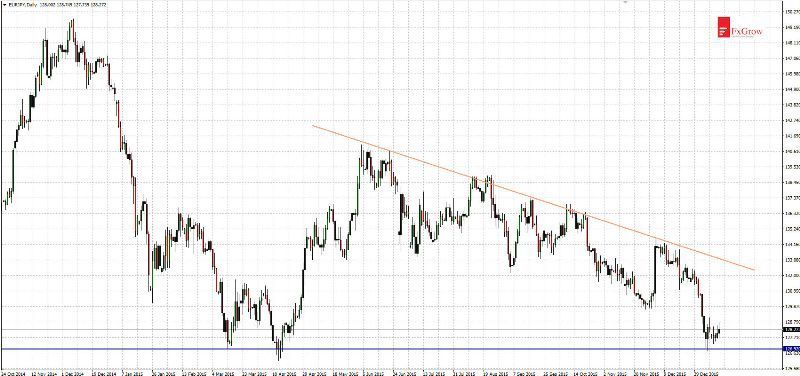
[B]Wider view, time-frame D1[/B]
Since December 2014 EURJPY moves in a downtrend, in last week price reached 8 months low. Currently price is near support, but it is very hard to see any good signals looking at the chart. Break below support at 126.90 could lead price to 120.50 and in a long term will look like trend reversal (because right now falls still could be seen as a correction in uptrend). Alternatively if rebound occurs the main challenge for the bulls will be break above resistance at 133.00, where right now is a downtrend line.
[B][I]For more in depth Research & Analysis please visit FxGrow.[/I][/B]
[I][B]Note:[/B] This analysis is intended to provide general information and does not constitute the provision of INVESTMENT ADVICE. Investors should, before acting on this information, consider the appropriateness of this information having regard to their personal objectives, financial situation or needs. We recommend investors obtain investment advice specific to their situation before making any financial investment decision.[/I]
[B]FxGrow Daily Technical Analysis – 14th Jan, 2015[/B]
[I]By FxGrow Research & Analysis Team[/I]
[B]EURJPY - failed attempt of break above triangle upper limit[/B]
In January there is a side trend at EURJPY and price formed triangle pattern. Today bulls tried to broke above upper limit of the triangle but they failed. Successful breakout could be very dynamic. If it is up, upward movement will be limited to 133.00. However if it is down, it will give a strong long-term trend reversal signal.
[B]Wider view, time-frame D1[/B]
Since December 2014 EURJPY moves in a downtrend, in last week price reached 8 months low. Currently price is near support, but it is very hard to see any good signals looking at the chart. Break below support at 126.90 could lead price to 120.50 and in a long term will look like trend reversal (because right now falls still could be seen as a correction in uptrend). Alternatively if rebound occurs the main challenge for the bulls will be break above resistance at 133.00, where right now is a downtrend line.
[B][I]For more in depth Research & Analysis please visit FxGrow.[/I][/B]
[I][B]Note:[/B] This analysis is intended to provide general information and does not constitute the provision of INVESTMENT ADVICE. Investors should, before acting on this information, consider the appropriateness of this information having regard to their personal objectives, financial situation or needs. We recommend investors obtain investment advice specific to their situation before making any financial investment decision.[/I]
[B]FxGrow Daily Technical Analysis – 15th Jan, 2015[/B]
[I]By FxGrow Research & Analysis Team[/I]
[B]AUDCAD - one week of correction and return to uptrend[/B]
Bulls strikes back on AUDCAD. New year started with falls after almost vertical upward movement which lasted in November and December last year. After two months of upward movement without any correction supply expected deeper correction. I assumed that should make rebound was 0.9740 where support coincides with Fibonacci 50%.
[B][I]For more in depth Analysis & Research please visit FxGrow.[/I][/B]
[I][B]Note:[/B] This analysis is intended to provide general information and does not constitute the provision of INVESTMENT ADVICE. Investors should, before acting on this information, consider the appropriateness of this information having regard to their personal objectives, financial situation or needs. We recommend investors obtain investment advice specific to their situation before making any financial investment decision.[/I]
[B]FxGrow Daily Technical Analysis – 15th Jan, 2015[/B]
[I]By FxGrow Research & Analysis Team[/I]
[B]AUD/USD deepens 6-year lows[/B]
Australian to US dollar fell during Friday’s trading below wide consolidation 0.7383-0.6900 drawn from the middle of the last year. As a result, long-term, more than 6-ytear lows on the Aussie has been deepened to 0.6862. If the price closes below that level, then traders will have an opportunity to look for supply signals.
[B][I]For more in depth Analysis & Research please visit FxGrow.[/I][/B]
[I][B]Note:[/B] This analysis is intended to provide general information and does not constitute the provision of INVESTMENT ADVICE. Investors should, before acting on this information, consider the appropriateness of this information having regard to their personal objectives, financial situation or needs. We recommend investors obtain investment advice specific to their situation before making any financial investment decision.[/I]
[B]FxGrow Daily Technical Analysis – 18th Jan, 2015[/B]
[I]By FxGrow Research & Analysis Team[/I]
[B]CHFPLN - breakout the upper limit of consolidation after S&P downgrade[/B]
On Friday rating agency Standard & Poor’s cut the Poland’s rating and warned of a further cut. S&P in note pointed at new government’s actions without reference to the Poland’s economy. Despite that other agencies does not opt to identical moves polish zloty weakened.
Currency pair CHFPLN is very popular because a thousands of Poles have debt in CHF.
[B][I]For more in depth Analysis & Research please visit FxGrow.[/I][/B]
[I][B]Note:[/B] This analysis is intended to provide general information and does not constitute the provision of INVESTMENT ADVICE. Investors should, before acting on this information, consider the appropriateness of this information having regard to their personal objectives, financial situation or needs. We recommend investors obtain investment advice specific to their situation before making any financial investment decision.[/I]
[B]FxGrow Daily Technical Analysis – 19th Jan, 2015[/B]
[I]By FxGrow Research & Analysis Team[/I]
[B]USDJPY an opportunity for rebound - double bottom pattern at support[/B]
After Friday’s selloff current week started with a rebound at USDJPY. Area of 116.50 was defended by demand because further declines (and especially support breakout at 116.00) will worsen technical situation on the chart. Changes in long-term trend to a downtrend will become a fact. Currently upward movement should reach 118.30 - 118.80.
[B][I]For more in depth Analysis & Research please visit FxGrow.[/I][/B]
[I][B]Note:[/B] This analysis is intended to provide general information and does not constitute the provision of INVESTMENT ADVICE. Investors should, before acting on this information, consider the appropriateness of this information having regard to their personal objectives, financial situation or needs. We recommend investors obtain investment advice specific to their situation before making any financial investment decision.[/I]
[B]FxGrow Daily Technical Analysis – 19th Jan, 2015[/B]
[I]By FxGrow Research & Analysis Team[/I]
[B]EURGBP - fast correction and return to uptrend[/B]
Since almost a year demand was unable to break above 0.7480. From the other side, supply likewise wasn’t able to broke below support at 0.6990. As a result on January 8 there was a successful breakout of consolidation upper limit and new dynamic upward impulse began.
[B][I]For more in depth Analysis & Research please visit FxGrow.[/I][/B]
[I][B]Note:[/B] This analysis is intended to provide general information and does not constitute the provision of INVESTMENT ADVICE. Investors should, before acting on this information, consider the appropriateness of this information having regard to their personal objectives, financial situation or needs. We recommend investors obtain investment advice specific to their situation before making any financial investment decision.[/I]
[B]FxGrow Daily Technical Analysis – 20th Jan, 2015[/B]
[I]By FxGrow Research & Analysis Team[/I]
[B]EURUSD - break above bearish regression channel[/B]
Since December 4th EURUSD moves in downward channel. First attempt of breaking above it, occurred on January 15th but finished with false breakout and returned into the channel. Currently there is a second attempt and price reached 1.0975 level. If withdrawal doesn’t occur, then upward move will reach at least the nearest resistance at 1.1050.
[B][I]To read Full in depth Analysis please visit FxGrow.[/I][/B]
[I][B]Note:[/B] This analysis is intended to provide general information and does not constitute the provision of INVESTMENT ADVICE. Investors should, before acting on this information, consider the appropriateness of this information having regard to their personal objectives, financial situation or needs. We recommend investors obtain investment advice specific to their situation before making any financial investment decision.[/I]
[B]FxGrow Daily Technical Analysis – 20th Jan, 2015[/B]
[I]By FxGrow Research & Analysis Team[/I]
[B]GBPJPY - is it a good time for a rebound?[/B]
GBPJPY falls second month in a row without any bigger correction. Firstly, supply broke below support at 175.50 and then 168.00. It took place without any attempt of a rebound. Today demand reactin occurred in area 163.00 - 163.70 and it was at the time when macroeconomic data were published.
[B][I]For more in depth Analysis & Research please visit FxGrow.[/I][/B]
[I][B]Note:[/B] This analysis is intended to provide general information and does not constitute the provision of INVESTMENT ADVICE. Investors should, before acting on this information, consider the appropriateness of this information having regard to their personal objectives, financial situation or needs. We recommend investors obtain investment advice specific to their situation before making any financial investment decision.[/I]
[B]FxGrow Daily Technical Analysis – 21st Jan, 2015[/B]
[I]By FxGrow Research & Analysis Team[/I]
[B]AUDNZD - upward movement should be continued[/B]
For 2 months AUDNZD moved in downtrend from 1.1080 level in November 2015 to 1.0535 level in January 7. Since then rebound occured, which is characterized by higher highs and higher lows (this is a basic method to identify trends). Currently price reached 1.0700 and it is likely that rebound will occur and demand will try another test of the latest resistance at 1.0830.
[B][I]For more in depth Analysis & Research please visit FxGrow.[/I][/B]
[I][B]Note:[/B] This analysis is intended to provide general information and does not constitute the provision of INVESTMENT ADVICE. Investors should, before acting on this information, consider the appropriateness of this information having regard to their personal objectives, financial situation or needs. We recommend investors obtain investment advice specific to their situation before making any financial investment decision.[/I]
[B]FxGrow Daily Technical Analysis – 21st Jan, 2015[/B]
[I]By FxGrow Research & Analysis Team[/I]
[B]EURUSD - declines after ECB press conference[/B]
Yesterday demand tried to break above bearish regression channel, but sentiment changes today after press conference of ECB President Mario Draghi. According to forcast ECB maintained interest rates unchanged, however during press conference, Draghi’s speach caused a weakening of the euro.
[B][I]For more in depth Analysis & Research please visit FxGrow.[/I][/B]
[I][B]Note:[/B] This analysis is intended to provide general information and does not constitute the provision of INVESTMENT ADVICE. Investors should, before acting on this information, consider the appropriateness of this information having regard to their personal objectives, financial situation or needs. We recommend investors obtain investment advice specific to their situation before making any financial investment decision.[/I]
[B]FxGrow Daily Technical Analysis – 22nd Jan, 2015[/B]
[I]By FxGrow Research & Analysis Team[/I]
[B]OIL BRENT - 10% gaings from the bottom - second day of rebound[/B]
There is dynamic rebound at OIL. Since 24 hours OIL BRENT gained more than 10% value, moving from 27.30 to 31.00. Rebounds at OIL were usually dynamic so while the key levels weren’t broken current movement should be seen as a correction. Key resistances are at levels: 36.00 (former support that stopped declines in December) and 42.50.
[B][I]For more in depth Analysis & Research please visit FxGrow.[/I][/B]
[I][B]Note:[/B] This analysis is intended to provide general information and does not constitute the provision of INVESTMENT ADVICE. Investors should, before acting on this information, consider the appropriateness of this information having regard to their personal objectives, financial situation or needs. We recommend investors obtain investment advice specific to their situation before making any financial investment decision.[/I]
[B]FxGrow Daily Technical Analysis – 22nd Jan, 2015[/B]
[I]By FxGrow Research & Analysis Team[/I]
[B]GBPUSD - dynamic rebound after price reached 6-years low[/B]
In Monday’s analysis (after upward movement in the morning) I pointed two scenarios: successful rebound or deepened falls: “it is likely that today will be first upward session since a week” and “however if demand fail and declines continue next support will be at 1.4000”.
Morning’s gains were lost by the end of the day and as a result at chart you can see next red candle with long upper shadow. As expected, price moved in the direction of 1.4000, but rebound on Thursday was 80 pips higher during ECB press conference.
[B][I]For more in depth Analysis & Research please visit FxGrow.[/I][/B]
[I][B]Note:[/B] This analysis is intended to provide general information and does not constitute the provision of INVESTMENT ADVICE. Investors should, before acting on this information, consider the appropriateness of this information having regard to their personal objectives, financial situation or needs. We recommend investors obtain investment advice specific to their situation before making any financial investment decision.[/I]
[B]FxGrow Daily Technical Analysis – 25th Jan, 2015[/B]
[I]By FxGrow Research & Analysis Team[/I]
[B]USDJPY - dynamic rebound from support after BoJ speech[/B]
Last Wednesday there was another test of 116.40 level, but supply wasn’t stopped and tried attack at 116.00. As a result USDJPY reached to a year’s low of price. Since December to last week’s Thursday Japan’s yen strengthened, during this time price fell from 123.56 to 116.00. At pointed level dynamic rebound occurred and during three upward sessions led price to Fibonacci 38,2% of previous downward movement.
[B][I]To read this Full in depth Analysis please visit FxGrow.[/I][/B]
[I][B]Note:[/B] This analysis is intended to provide general information and does not constitute the provision of INVESTMENT ADVICE. Investors should, before acting on this information, consider the appropriateness of this information having regard to their personal objectives, financial situation or needs. We recommend investors obtain investment advice specific to their situation before making any financial investment decision.[/I]