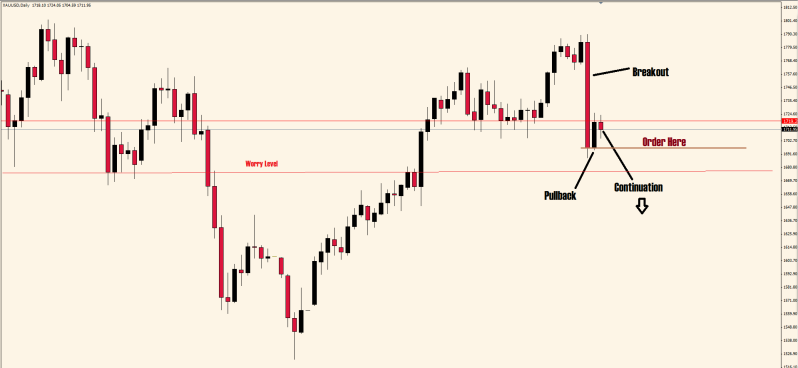
Gold certainly looks promising. It’s a nice bearish engulfing rejected right off of a resistance line. IF you move up to the monthly it also has a pin candle from last month that would support the weekly. The weekly is what I would consider at that top of an uptrend because it has already made two Higher Lows after a Higher High (this would be the second HL). I would probably enter when it crosses the brown line on the chart below (daily TF). It has hit a fairly strong resistance and formed what looks like a nice BPC pattern. The one problem is that you would be trading into a support that is pretty obvious on the daily (lower read line, worry level)… Not so much on the weekly, but still there. I still might take this trade and just move it to break even when it hits that level. If (most likely) it hits my BE I’ll just reenter if it looks like it will continue down again.
Determining when the trend has/is changed(ing) is something that I don’t think has been covered in this thread. Personally, I determine it by price making Higher lows and using lower lows to support that which gold is in fact doing on the weekly’s. Jonathon might (probably) does it different, but it’s what works for me. The waves are kind of messy and I’m not sure I would even take this trade purely off the weekly. Instead I would look at the daily or 4H to get a good entry with a minimum SL.
good to see you posting. Two days ago when we saw that rejection candle I thought the chance for a decent pullback was looking likely. This Pin however has failed to break lower and price is once again testing the recent highs.
The problem price will have trading back lower is all the traffic it will encounter on its way back down.
Now what is important is the box that price is stuck in at the moment. Notice how we have had rejection candles in this box both ways that touch the top and bottom of the box almost to the pip? It is to early to say anything until we have a clear break of this box. Once this happens we will normally break out hard and fast and then price will retrace and test again. It is here will will get our entry.
It is much easier to explain on a chart. So if price break the box higher we would look for price to rotate back lower and for us to get long and if it breaks lower for price to come back up and test lows to get short. make sense?
If Gold had of closed below these two area this would have made it much easier decision than it was. We have Non farm payroll this week which mean trading will be thin. Ne prepared!
Now lastly I need to say when analysing a setup it is much much easier to do it of the same chart. For example if you are looking at a setup on the weekly chart it is much easier to set stop and target and etc by only looking at the weeekly chart. It only complicates things taking a setup of one chart and then markeing S/R of a smaller chart.
Good luck and one last thing. DO NOT not take a trade because of what I have just said. This is my opinion. I do think Gold will go lower sooner or later but just for me I can’t take part.
I will try and go through your points one at a time.
1: The S/R level I have marked is highly relevant. I will attach a chart straight under this post hopefully highlighting what I am talking about. When looking at support and resistance sometimes it is extremely important to look at when price has closed above or below or when price has struggled to do so. This can tell us a huge amount of info. The line I have marked is on the weekly chart and you will notice just how much price has respected this level. Now the interesting thing is just how strongly price closed through this level and below it last week.
2: You are 100% correct. It is actually a 2 bar reversal. A setup I have spoke of in her a little but not a whole heap. It is beasically the same mentallity as a Pin bar. Price goes up and gets rejected and snaps back down. So yes there is a signal. I will even show you a little magic that most don’t know you can do on a MT4 chart. As you have seen the weekly chart I won’t post that again but I will post the setup but this time in a 2 week chart. Now you know how I said it was basically a pin bar well on the 2 week chart it is a pin bar. It is just candle blending. So instead of seeing the 2 candles we now see both put together to form 1.
PS: I also forgot to mention that yes you are correct that price has found support on the daily chart at arround 1.3200. I haven’t spoken to much about entries yet in here but i always enter at a break so if someone was to enter this of the weekly chart they would be entering at 1.3165 and well lower of the support area. This way support would have to be broken for an enter to be made and if support is broken no trade is lost.
Trend is something we can cover in coming weeks. I was just thinking and I have made over 150 posts in here already and we haven’t even covered entries correctly yet! Anways no rush!
I was watching that one closely, it was one of my favorites from my scans today. However, the GBP/USD is looking very good too. It’s currently testing support right now. I’ll be watching this one closely. I have an idea it may go up but I’m way to new at this to be making predictions. I’ll just watch from the sideline and learn as a newbie.
I do have an active account and trade micro lots. I learned so much from this thread. As a new investor, it felt like I was getting “information overload”. I was immersed in so many tehnicals, from bollinger bands, to STOCS, RSI, Parabolic SAr, you name it, I’ve tried it. My charts used to look like Times Square in NY, I had so many colors and funny shapes. Finally, you showed that trading could be less stressful. Long story short, I’ve been following this post closely and had 3 consecutive winning trades in the past week. I normally make one trade a day. I know losing is part of the game, I haven’t found an investor yet that has a 100% win ratio. I’m prepared to lose but I must cut my losses short, stay focused and take it one day at a time. I did take the long on GBP/USP. I’ll have to see what happens. Despite all, I’m only bought one micro lot so at least I’ll learned from this experience. It’s encouraging reading all the other posts on this thread. Very good info.
Deep stuff right there Johnathon!, much appreciated. It’s crazy that I didn’t notice that the weekly BEEB had formed at a MAJOR support Also I agree, i made the mistake of marking S/R on a Daily and looking for confirmation on Weekly. Lesson learned.
Seems to me that Gold is trading in a range.
And now it’s formed a BEEB at an important resistance level at the top of the range.
So i think price is going to go downwards, and, if still in a range, head towards 1528 level in the coming months (!)
Minor support areas as I see them (weekly): 1680.58 & 1607.50


 Also I agree, i made the mistake of marking S/R on a Daily and looking for confirmation on Weekly. Lesson learned.
