I really like where this is going, looks really intristing
Interesting…seems sensible!
Somewhere here on babypips is a thread showing how to post pictures. It may take some searching to find it though.
or were you wanting to post the actual spreadsheet? in that case you can attach it as a zip file.
What is great about this thread is that Pipso is presenting a very professional way to approach trading, yet most retail traders will simply ignore it because it doesn’t promise unrealistic returns. All of which is fine with me, since I trade this way too 
Keep it coming Pipso!
Happy Trading,
Art
Here’s a link to the thread where it tells you how to post pictures. If you want to screen print your excel and post the picture in your post.
http://forums.babypips.com/newbie-island/30564-how-post-charts-forum-upgraded.html
Thanks for the link, TalonD.
I’m working on the next post.
Pipso,
Do you optimize the settings for each instrument you trade? Also, do you find that some contracts aren’t profitable enough to trade live, or do you trade as many as possible just in case of a large move?
Thanks,
Art
Yes, but I’m looking for a range of numbers that work well, not necessarily the best ones. For example, the USD/JPY seems to like 15-30 days, while the USD/CAD likes 50+ days.
I also like to run simulations for the same instrument but on different segments of time. So, I might optimize for 1990-2000, then take those numbers and see how they do from 2000-2009. If the difference isn’t too great, I feel more comfortable going forward (live).
I’ve run this system on 20+ currencies and found perhaps one or two that either barely break even, or loose a little. This gives me confidence in the robustness of this system.
Systems that work wonderfully with one instrument and not with others tend to be over-optimized.
I trade as many as possible, but ultimately this number is limited by my available equity, and by the fact that some currencies are highly correlated.
I think that my next few posts will shed more light on these issues.
One of the main rules that Trend Traders follow is to cut their losses short. We don’t get attached to a particular trade and hope that it’ll turn around for us.
Some traders may think they have some knowledge, or sometimes get a ‘feeling’ about what’s going to happen in the market and place their trades accordingly. Many times they are proven correct, and that only reinforces their beliefs in their ‘forecasting’ abilities. But when they are wrong, the tendency is to stick with the trade because, after all they ‘know’ which way it ‘should’ go and if they just wait a little longer, they will be ‘right’.
This can get costly. So we cut our losses short and have money left over to trade another day.
We simply decide how much we are willing to loose on each trade. Again, here we focus our attention on what we can really control. We cannot control how much we will win. But we can control how much we loose by simply closing our trades.
In the next few posts, we will optimize our position size as well, but for now let it be 5%. So if our available equity is $10,000, our position size would be $500.
Our system already takes into account recent market volatility to determine our exit point. We have wider stops in highly volatile markets, and tighter stops in calmer markets. This gives our trade some “room to breathe”.
So if we take our $500 and divide it by the difference between our entry stop and exit stop, we get how many units we should buy or sell:
(Available Equity * Position Size%) / (Stop Price - Protective Stop) * Lot Size
So on a Pound trade:
$500 / (1.5853 - 1.5000) * 1000 = 5.86 micro lots
We can round this off and buy 6 micro lots.
Next, we will optimize our Position Size.
Earlier, I mentioned that one way to evaluate a system is to look at its risk/reward. To evaluate our reward, we can look at our Growth Rate, and to evaluate our risk, we can look at our Max Drawdown.
If we divide our Growth Rate by our Max Drawdown, we get a ratio. The closer this ratio is to zero the worse our system’s performance, and the closer it is to 1, the better (it can be greater than 1, but achieving such results is quite difficult)
So, if our Growth Rate is 5%/year, and our Max Drawdown is 20%, our ratio is 0.25. If our Growth Rate were 10% with the same Max DD, the ratio would be 0.50, which is much better. This is useful because we can look at a single number for system comparison.
One way to increase a system’s Growth Rate is to increase position size. Of course this also has the effect of increasing Max DD. Theoretically, we can keep increasing our Growth Rate, but in practice we need to keep our Max DD in mind because a large DD might get us to stop trading. What the ideal ratio is depends on the individual trader’s tolerance.
Varying our position size will have an identical effect on our Growth Rate and our Max DD, so the Ratio will stay the same, but of course our Equity will grow much faster.
In the following example, I’ve run the same system twice, the first time with 2.5% position size, the second with 5% position size. Take a look at what happens to our Equity:

By doubling the size of our position, we’ve doubled our profits. We’ve also doubled our Max DD. The process of optimizing your Position Size is finding a balance you can be comfortable with
So, we’ve covered how to optimize our entries/exits and our Position Size. Next, I will go over our last system rule, “what instruments to trade” and how this can further improve our profitability.
And now, for my last installment, a little math-gic:
We’ve already seen how you can improve a system by optimizing its parameters. First, we improved our entries/exits by optimizing our “indicator”. Then, we looked into optimizing our position size to maximize our system’s growth rate while keeping drawdowns to an acceptable level.
We’ve run out of parameters to adjust, but let’s see what happens when we trade not one, but two instruments;
In this example, I’ve added the GPB/USD to our original USD/JPY. I’ve run both over the same time segment, between 1994-20009. I’ve optimized both systems entries/exits, set position size to 5% and initial equity at $5000. Then, I ran both systems together. As expected, if we add the gains of each system, we get the gains of the two combined. But take a look at what happens to our drawdowns:
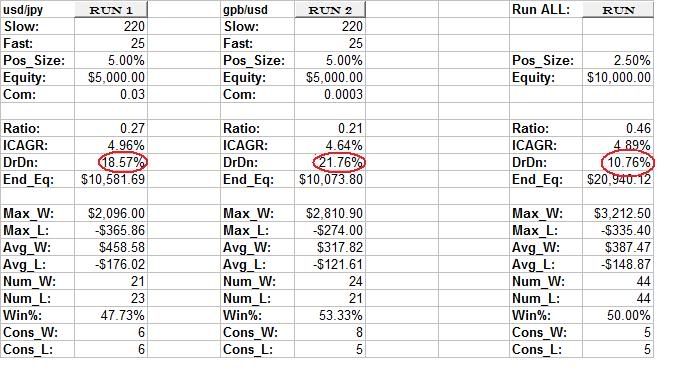
We’ve nearly cut it in half. What this allows us to do is increase our position size without increasing our drawdowns. So, if we compare our original USD/JPY system with 5% position size, and we add a GPB/USD system, we get the following results:
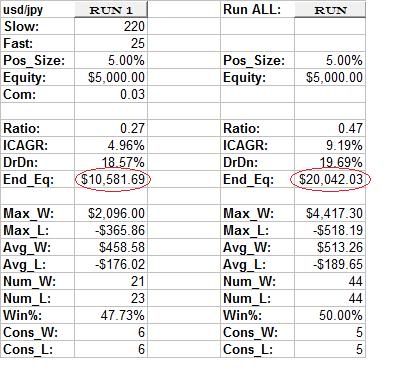
Notice that our equity gains tripled. A fixed percentage of equity as position size combined with diversification allows a trader to benefit from exponential growth.
This concludes our discussion. I will monitor this thread to answer questions of anyone who may be interested in duplicating these results.
sounds very interesting i am enjoying this thread 
last installment? :eek:
hey, what happened to the picture in post number 33?
We’ve increased our system’s profits from around $4000 to over $35,000. Traders can use the methods we discussed to build their own system. I am open to discuss issues traders have in developing and/or following their systems. We can also broaden the scope of this thread to any other topic related to Trend Following. I am open to suggestions.
Thanks for the catch. It now is back. I have also updated the attachment to post #16 to make it easier to see. By the way, thank you for the help with the pictures and attachments.
Thanks for taking the time to write this, I have a few questions:
Firstly I am assuming that you are using a daily candle chart for your example.
When you talk about Highest Highs and Lowest Lows are you talking about the min & max values for each candle or are you using only the candle opening or closing values?
In the section regarding entry points you state:
If current price > highest high in 200 days LONG TREND IS UP
If current price < lowest low in 200 days LONG TREND IS DOWNIf the long trend is up:
If current price > highest high in 30 days ENTER LONG
with a protective stop at the lowest low in 30 daysIf the long trend is down:
If current price < lowest low in 30 days ENTER SHORT
with a protective stop at the highest high in 30 days
So if current price > highest high in 200 days then by default current price > highest high in 30 will also be true. So really you are using only current price > highest high in 200 days to go long and visa versa for going Short. Or am I missing something?
When you enter a trade, do you enter as soon as the price is above(Long)\below(Short) the entry price or do you wait for a new candle to open above(Long)\below(Short) the entry price?
And the same question regarding the stops?
Do you ever add more trades to a position as the trend moves on?
Correct, this system uses daily data. The performance drops off significantly with lower time frames.
Yes, so each day I enter the day’s High and Low (Max/Min), and my spreadsheet figures the highest of these values over the last 20 days for long entries and vice versa for short entries.
The 200 day period acts as a long term filter. I define the long term trend as UP if current price > highest high in 200 days. The trend switches to DOWN when current price < lowest low in 200 days.
If the long term trend is UP, I only take LONG trades using a 20 day entry/exit and vice versa.
[B]If current price < lowest low in 20 days but still higher than lowest low in 200, I don’t take that short trade.[/B]
At the end of each day, I place [B]stop orders[/B] for the next day to enter/exit as soon as the price reaches my target.
The same results achieved by waiting until the close of a candle can be duplicated by simply adding 1 day to my lookback period. So instead of looking at 20 days, I would look at 21. Since I’ve optimized the amount of days, I see no need to add another level of complexity to achieve identical results.
Pyramiding can add to the success of a strategy, but it also needs to be thouroughly backtested. The methods I’ve outlined thusfar have a far greater impact, so I’ve left pyramiding out of this particular thread.
These are great questions. Thanks for contributing.
lookin forward to using some of these things in my current strategy
that math magic in post 34 confuses me but I’ll read it again till I get it.
Just wondering, how do you do your backtesting? You said performance drops off on lower time frames but I’ve been trying to use a 1h trend following and would like a good way to back test it.
Maybe I can explain a little better.
In the first example, I run a system on USD/JPY only:
Starting Equity: $5,000
Position Size: 5%
This results in:
Ending Equity: $10,581.69 (Profits: $5,581.69)
Growth Rate: 4.96%
DrawDown: [B]18.57%[/B]
In the second example, I’ve run the same system on GPB/USD:
Starting Equity: $5,000
Position Size: 5%
This results in:
Ending Equity: $10,073,80 (Profits: $5,073.80)
Growth Rate: 4.64%
DrawDown: [B]21.76%[/B]
If we run these two systems at the same time, we get:
Starting Equity: $10,000
Position Size: 2.5%
This results in:
Ending Equity: $20,940.12 (Profits: $10,940.12)
Growth Rate: 4.89%
DrawDown: [B]10.76%[/B]
So, by running both system together, we add our profits as expected, but we reduce our drawdowns by nearly 50% !!
We can simply enjoy our combined profits with our reduced DrawDown, or, if we’re bold, we can raise our position size.
This is what happens if we run both systems together again, this time with double position size:
Starting Equity: $10,000
Position Size: 5%
Results:
Ending Equity: $38,603,45 (Profits: $28,603.45)
Growth Rate: 8.94%
DrawDown: 20.51%
Notice that when you double your position size, your profits grow exponentially (they’re not simply added)
With a single instrument to trade, if you double your position size, you also double your DrawDowns. 
Adding instruments (diversifying) allows us to increase our position size while keeping our DrawDowns similar. 
I simply use Excel. It takes a little work, but I can put the money I save in my trading account.
When I was testing this system, I thought that running it on 1hour time frames would give me more trading opportunities and that this would result in greater profits.
After testing and optimizing, I found that this is not the case. The hourly system needed around 500 hours look-back periods to become profitable, which of course made it identical to the daily system. (around 25 days)
I can show you the results, if you’re interested.
busy remodeling today but when I get a little time, I’ll devote a some brain cells to that math magic and make sure I get it. It never occurred to me that diversifying like that could have such benefits.
I wouldn’t mind seeing the results you got with 1h time frames. What I’ve been doing is a gbp/usd 1h basically a moving average cross over. it works pretty good but I still get into trouble with ranges. You’ll see trends that are good for a couple hundred pips that last a two or three days and I’m trying to capture those.