USD/JPY may finally be on the cusp of a larger turn as price has pushed up towards the 150.00 level and is now testing the 200-day moving average as support.
By : James Stanley, Sr. Strategist
USD/JPY, Japanese Yen Talking Points:
- USD/JPY has continued a pullback into early-week trade following last week’s stall inside of the 150.00 level. At this point, the 200-day moving average is being tested as support after the show of resistance in early-September.
- Yen-weakness remains a viable FX theme although there still may be a more amenable backdrop for such against the Euro or British Pound, looked at most recently last week. Since then, EUR/JPY has put in the 175.00 inflection and pulled back for a test of support at prior resistance.
- I look into the Japanese Yen from the perspective of USD/JPY, EUR/JPY and GBP/JPY in each weekly webinar, and you’re welcome to join. Click here to register.
The Japanese Yen continues to hold a degree of weakness as we near the Q4 open. After USD/JPY plunged down for another test of the 140.00 level in April, driven by both recessionary fears in the US along with the vast unknown of what the consequences of ‘Liberation Day’ tariffs might be, the pair threatened to break-down to a three-year low while taking out a critical support level at the 140.00 handle.
That was not to be, however, as both equities in the US came back with strength and USD/JPY started to set a pattern of higher-lows that continues as we near the Q4 open.
The first day of Q3 brought another swing-low in DXY but in USD/JPY, that was a higher-low, right around the 142.80 level. The trendline from the April low to that low came into play two weeks ago, at the Fed’s rate cut announcement; and, again, it held support as buyers got back in the driver’s seat.
The weekly chart below is illustrative of this backdrop as much of the past two months have been a gyrating sideways move in USD/JPY, even as the US Dollar pushed down to a fresh three-year low as markets prepped for Fed rate cuts to come online.
USD/JPY Weekly Chart
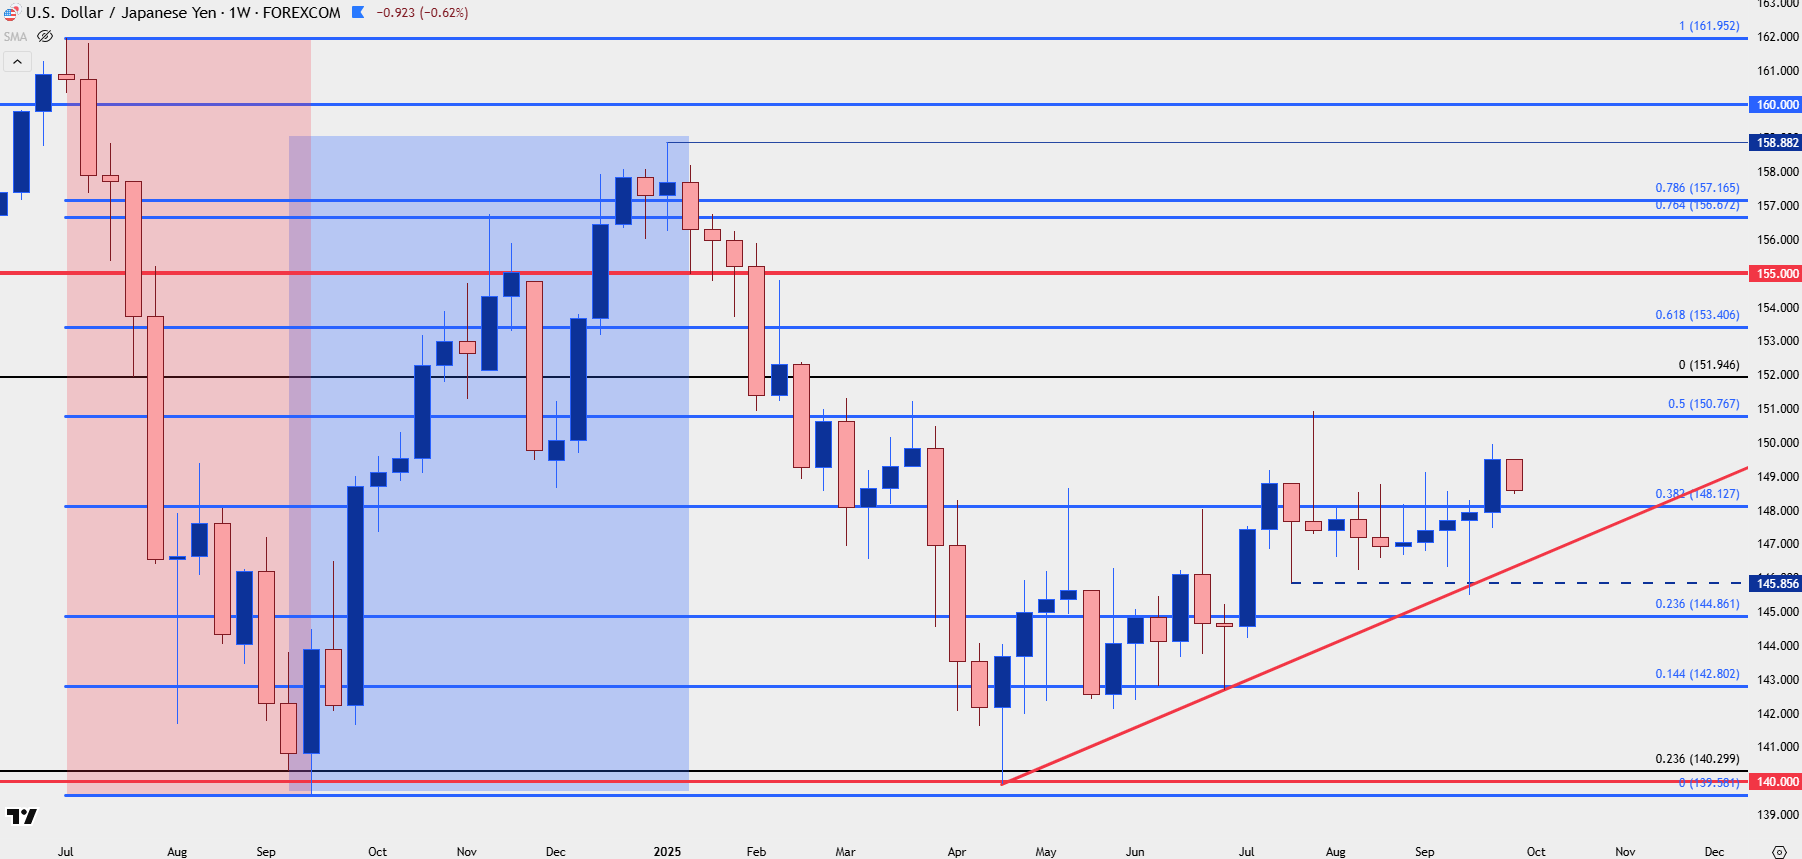
Chart prepared by James Stanley; data derived from Tradingview
USD/JPY Contrast with the USD
Perhaps the most attractive element of current USD/JPY price action is how well it contrasts with the USD, and the deduction of that illustrates Japanese Yen-weakness. As I’ve been saying for much of this year, that Yen weakness could be more attractive to traders elsewhere, such as EUR/JPY or GBP/JPY.
Where this could begin to change, however, is if we see USD-strength on its way back, and given the response since the FOMC rate cut two weeks ago, that’s a possibility that should be entertained, especially considering what happened last Q4.
There’s quite a bit of similarly to USD/JPY, as well, as last year’s start of FOMC rate cuts helped to drive USD/JPY down for a test of that same 140.00 handle that was in-play in April; but as USD-strength came back to life in Q4, so too did USD/JPY, and there was a massive reversal in the pair that held through the 2025 open.
Given the JPY-weakness that’s been in-play for much of the past five months, a jolt of strength in the USD could suddenly make USD/JPY as attractive again for trends. We’ve seen glimpses of that already, like the late-July breakout in USD/JPY which tracked with the strongest monthly outing for the Dollar in more than three years. USD/JPY put in an aggressive breakout at that point, jumping above the 150.00 handle and finally finding resistance at the 150.77 Fibonacci level. Then when the USD snapped back after the NFP report on August 1st, USD/JPY did too, and then meandered in a range for almost two months.
That range is what bulls broke through last week following the FOMC rate cut. That rally ran all the way until the 150.00 level was almost in-play, with price coming just four pips away from the big figure, and that’s the point where buyers suddenly lost interest in chasing the move. But the pullback from that, so far, has held support around the 200-day moving average and this keeps the door open for the possibility of bullish trend continuation as we move towards the Q4 open on Wednesday.
USD/JPY Daily Chart
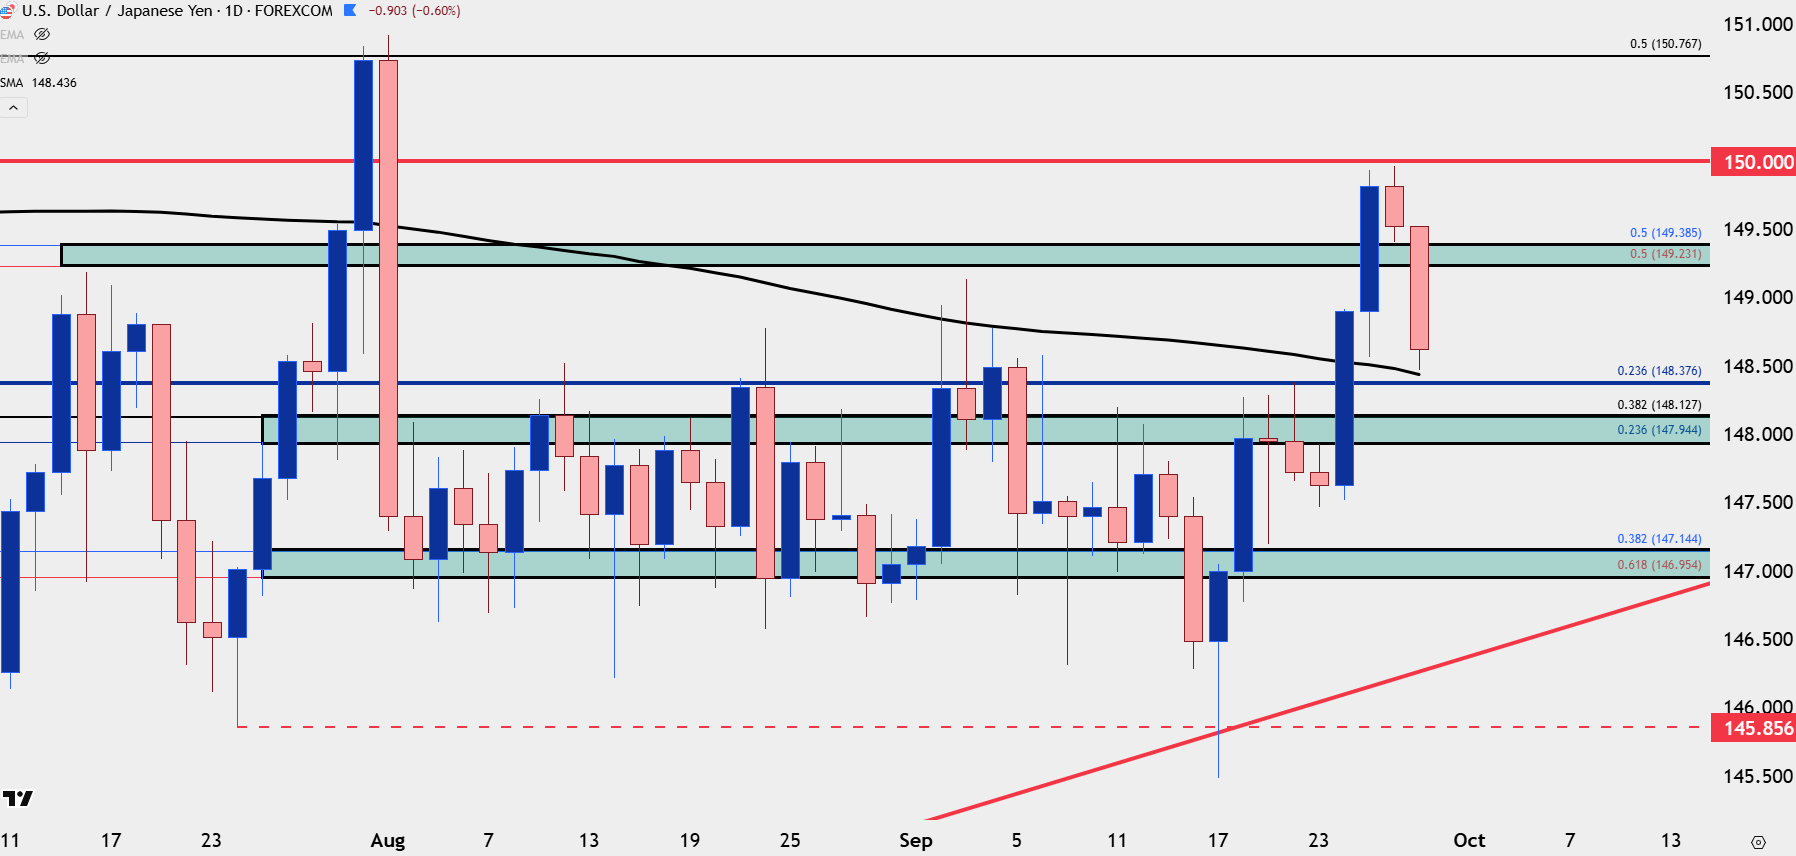
Chart prepared by James Stanley; data derived from Tradingview
EUR/JPY
Until there’s greater indication of USD-strength, that Yen-weakness could be seen as more attractive elsewhere, and EUR/JPY is included.
I’ve talked a lot about the importance of the 175.00 level in the pair and last Wednesday, I had highlighted a bearish reversal formation that had started to brew as buyers had begun shying away from the big figure. The level traded late last week, and to open this week, a strong snap back move has shown.
The levels looked at in last Wednesday’s JPY article have since come into play as support and there’s even the possibility of higher-low support at the ‘s1’ level looked at then. Ideally, a re-test of the 173.90 level would come into play as that price set resistance twice before the September breakout, but for bulls that want to press the move aggressively, there can be an open door for such.
At this point, I want to remain cautious of the 175.00 level until we see greater evidence that bulls will be able to drive through it, so pullbacks and trend strategies remain more attractive than breakouts.
EUR/JPY Four-Hour Chart
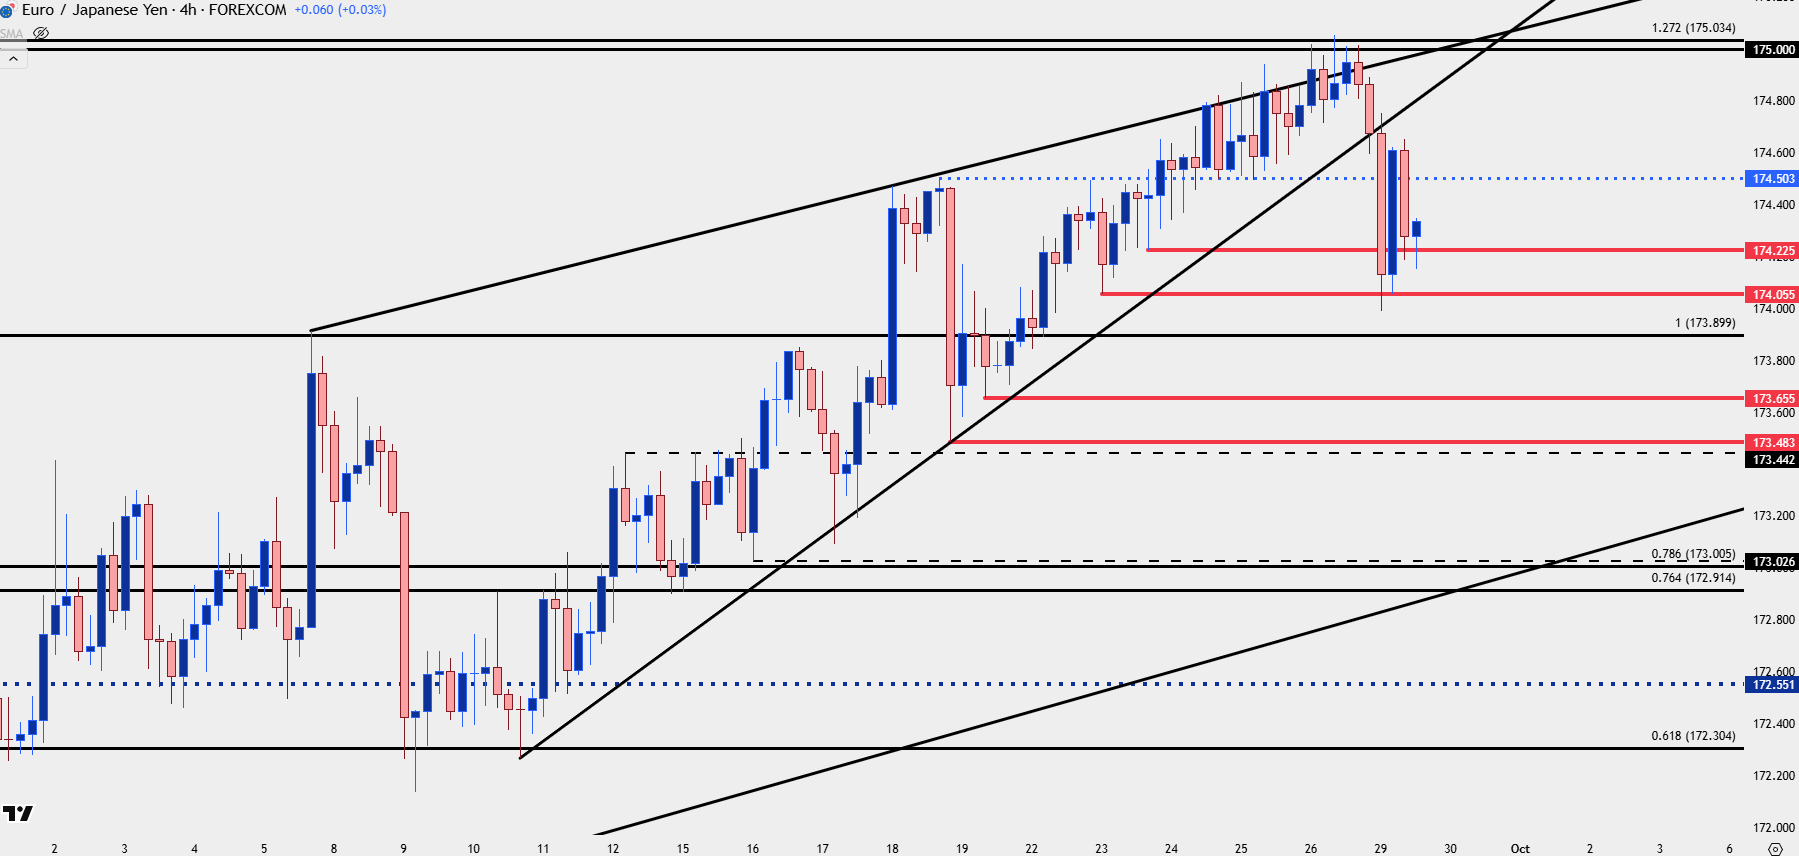
Chart prepared by James Stanley; data derived from Tradingview
— written by James Stanley, Senior Strategist
The information on this web site is not targeted at the general public of any particular country. It is not intended for distribution to residents in any country where such distribution or use would contravene any local law or regulatory requirement. The information and opinions in this report are for general information use only and are not intended as an offer or solicitation with respect to the purchase or sale of any currency or CFD contract. All opinions and information contained in this report are subject to change without notice. This report has been prepared without regard to the specific investment objectives, financial situation and needs of any particular recipient. Any references to historical price movements or levels is informational based on our analysis and we do not represent or warranty that any such movements or levels are likely to reoccur in the future. While the information contained herein was obtained from sources believed to be reliable, author does not guarantee its accuracy or completeness, nor does author assume any liability for any direct, indirect or consequential loss that may result from the reliance by any person upon any such information or opinions.
Futures, Options on Futures, Foreign Exchange and other leveraged products involves significant risk of loss and is not suitable for all investors. Losses can exceed your deposits. Increasing leverage increases risk. Spot Gold and Silver contracts are not subject to regulation under the U.S. Commodity Exchange Act. Contracts for Difference (CFDs) are not available for US residents. Before deciding to trade forex, commodity futures, or digital assets, you should carefully consider your financial objectives, level of experience and risk appetite. Any opinions, news, research, analyses, prices or other information contained herein is intended as general information about the subject matter covered and is provided with the understanding that we do not provide any investment, legal, or tax advice. You should consult with appropriate counsel or other advisors on all investment, legal, or tax matters. References to FOREX.com or GAIN Capital refer to StoneX Group Inc. and its subsidiaries. Please read Characteristics and Risks of Standardized Options.