FxGrow Daily Technical Analysis – 20th Sept, 2016
By FxGrow Research & Analysis Team
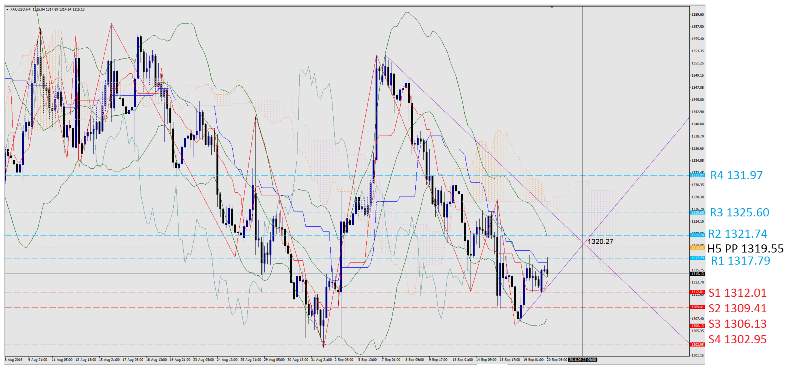
GOLD STILL TRADING IN YESTERDAY ZONE 1310/1315, BELOW WEEKLY PIVOT 1315.30, BEARISH TREND INDICATION
Since yesterday, XAUUSD is still trading below weekly pivot, and failed to break it’s first resistance station at 1317.79 which suggests a more downward trend into 1310 zone and maybe lower than that. With the absence of major news today that could affect gold, it’s expected to trade between 1310 and 1317 area. Tomorrow, 21 Sep, the most important news during 2016 will be released by U.S government FOMC having huge impact on commodities (GOLD, Silver ), major currencies. In other words, tomorrow news set of rulers will be applied that will set the trend for the coming weeks, even months.
For more in depth Research & Analysis please visit FxGrow.
Note: This analysis is intended to provide general information and does not constitute the provision of INVESTMENT ADVICE. Investors should, before acting on this information, consider the appropriateness of this information having regard to their personal objectives, financial situation or needs. We recommend investors obtain investment advice specific to their situation before making any financial investment decision.
FxGrow Daily Technical Analysis – 21st Sept, 2016
By FxGrow Research & Analysis Team
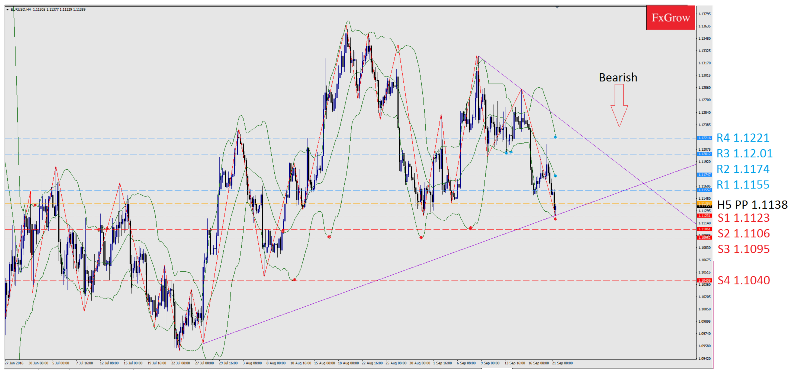
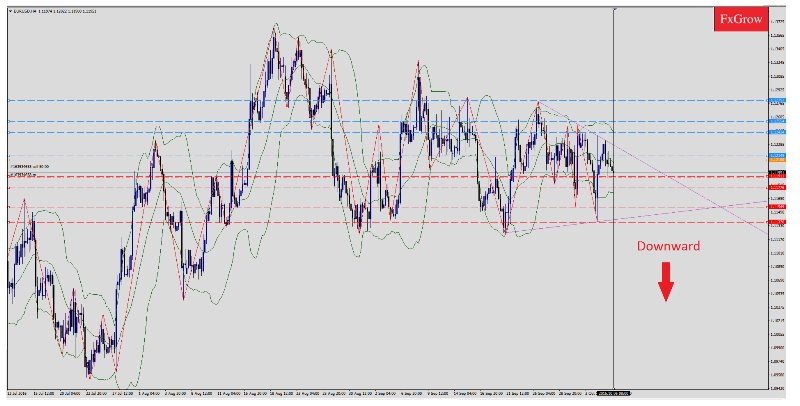
EUR/USD FAILS TO SUSTAIN 1.12 ZONE, U.S DOLLAR STILL MOVING BULLISH AGAINST ALL CURRENCIES
EUR/USD is still trading since Friday 16 Sep below weekly pivot 1.1195. On Friday, EUR/USD clocked a high 1.1250 but failed to maintain this level, it dropped dramatically later trading now at 1.1138, still below weekly pivot which indicated a more bearish drop for later on. Today major news on U.S FOMC that will dictates the market trend for the coming weeks.
For more in depth Research & Analysis please visit FxGrow.
Note: This analysis is intended to provide general information and does not constitute the provision of INVESTMENT ADVICE. Investors should, before acting on this information, consider the appropriateness of this information having regard to their personal objectives, financial situation or needs. We recommend investors obtain investment advice specific to their situation before making any financial investment decision.
FxGrow Daily Technical Analysis – 21st Sept, 2016
By FxGrow Research & Analysis Team
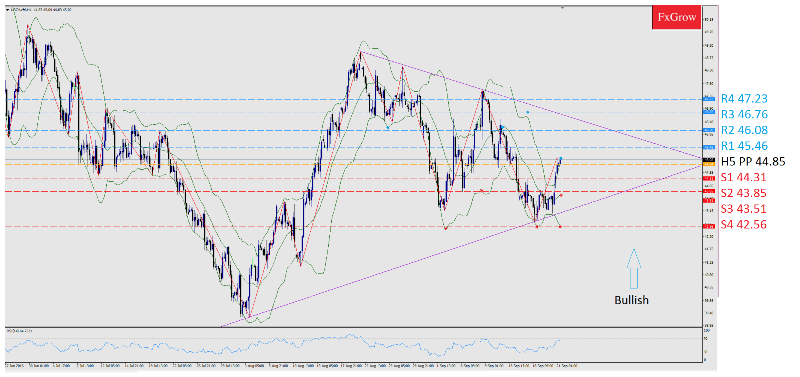
CRUDE OIL JUMPED 1% ON WEDNESDAY, HOURLY CHARTS INDICATES STRONG BUYING, AWAITING EIA REPORT, LATER ON FOMC
Crude oil jumped 1% today, rallied up from 43.96 and clocked a high intraday 45.10 at crude oil opening. Crude oil is scoring bullish hourly candle charts and right now trading above H5 PP which indicates a more bullish trend ahead of crude oil inventories report today at EIA 3:30 PM GMT, later on FOMC at 7 PM GMT. The market might witness a high volatility of either mix trend ( if news were mixed ) or more bullish if EIA and FOMC reports supported the trend positively.
For more in depth Research & Analysis please visit FxGrow.
Note: This analysis is intended to provide general information and does not constitute the provision of INVESTMENT ADVICE. Investors should, before acting on this information, consider the appropriateness of this information having regard to their personal objectives, financial situation or needs. We recommend investors obtain investment advice specific to their situation before making any financial investment decision.
FxGrow Daily Technical Analysis – 22nd Sept, 2016
By FxGrow Research & Analysis Team
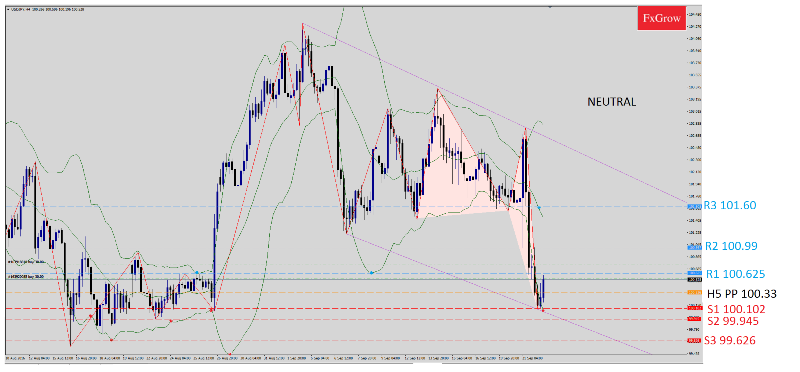
USD/JPY STANDS A GUARD AGAINST THE 100.00 DOOR, MAKES A REBOUND TO 100.60 ZONE 9 am GMT
The BOJ decision to leave the interest rates unchanged & take on a new policy keeping 10-year bond yields near zero caused massive wave of selling volumes. Add to that later on, the FOMC left rates the same, unchanged, changed ground rules as analytics were expecting an increase. The greenpack look weak and dragged USD/JPY into one month low. The USD/JPY is expected to trade in neutral area between first support S1 100.102 and first resistance R1 100.625. The only reason to break these barriers is today the U.S unemployment claims report at 1:30 Pm GMT which will cause am increase in buying and selling by traders that will either break either support levels or resistance levels.
For more in depth Research & Analysis please visit FxGrow.
Note: This analysis is intended to provide general information and does not constitute the provision of INVESTMENT ADVICE. Investors should, before acting on this information, consider the appropriateness of this information having regard to their personal objectives, financial situation or needs. We recommend investors obtain investment advice specific to their situation before making any financial investment decision.
FxGrow Daily Technical Analysis – 23rd Sept, 2016
By FxGrow Research & Analysis Team
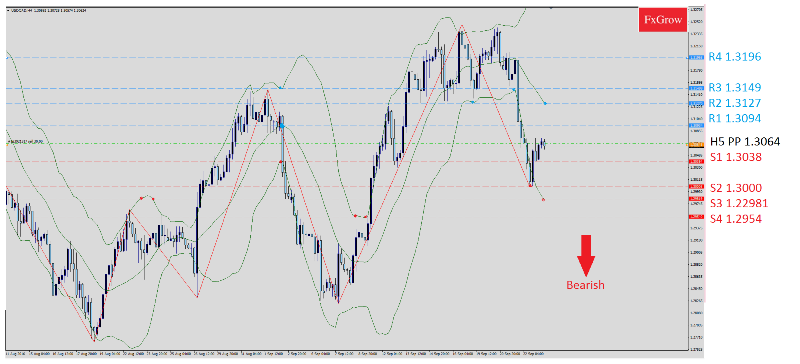
USD/CAD FLIRTING WITH 1.3060 ZONE AFTER DROPPING TO 1.3000
The USD/CAD dropped to lowest near 1.3000 since 13 Sep then rallied up again trading around H5 PP 1.3060. The FOMC release leaving rates on the U.S Dollar unchanged and the U.S Unemployment Claims yesterday, made the Canadian dollar move stronger than the greenpack. The U.S dollar has been moving very strong facing major currencies and commodities until Wednesday FOMC, Later on Unemployment Claims yesterday. The USD/CAD might drop more today if the Canadian Core CPI 1:30 PM GMT came positive supporting the Canadian Dollar to move stronger than U.S Dollar, and vise versa.
For more in depth Research & Analysis please visit FxGrow.
Note: This analysis is intended to provide general information and does not constitute the provision of INVESTMENT ADVICE. Investors should, before acting on this information, consider the appropriateness of this information having regard to their personal objectives, financial situation or needs. We recommend investors obtain investment advice specific to their situation before making any financial investment decision.
FxGrow Daily Technical Analysis – 24th Sept, 2016
By FxGrow Research & Analysis Team
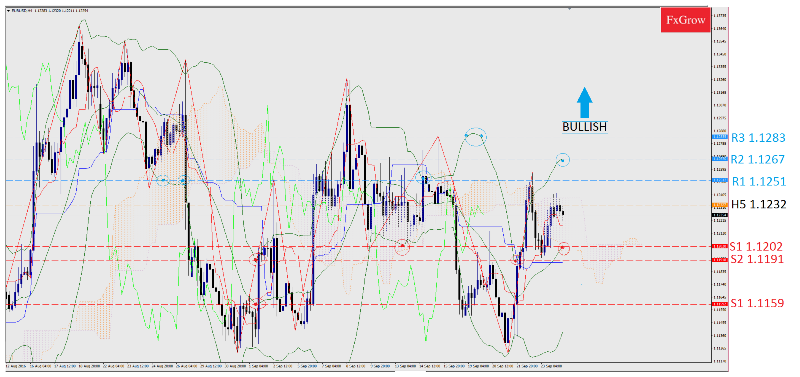
EUR/USD FLIRTING WITH 1.1220 ZONE, ABOVE WEEKLY PP, AHEAD OF IFO, LATER ON DRAGHI
The EUR/USD, right now trading in it’s normal range after dropping to 1.1148 on 16th Sep. The EUR strengthen facing the U.S dollar, started a bullish and clocked 1.1257 on 22th Sep and right now trading in the 1.1235 range, also expected to increase later on today after last week press releases on the U.S economy.
Data wise in the Old Continent, the German IFO is expected to improve in all of its components for the current month followed by the speech of President M.Draghi and board member E.Nowotny.
For more in depth Research & Analysis please visit FxGrow.
Note: This analysis is intended to provide general information and does not constitute the provision of INVESTMENT ADVICE. Investors should, before acting on this information, consider the appropriateness of this information having regard to their personal objectives, financial situation or needs. We recommend investors obtain investment advice specific to their situation before making any financial investment decision.
FxGrow Daily Technical Analysis – 04th Oct, 2016
By FxGrow Research & Analysis Team
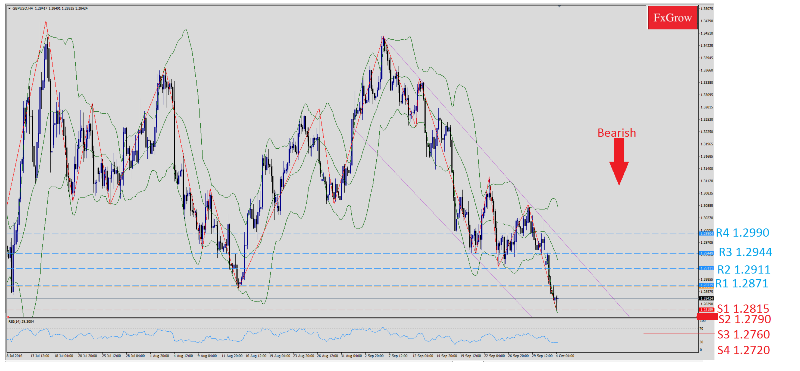
GBP/USD CONTINUES IT’S BEARISH MOMENTUM HEADING TO 30 YEARS LOW, AWAITING UK PMI
The GBP/USD kept dropping as Asian session opened hitting a low 1.2816 inching to 3 decades lows under 1.28. Yesterday, in respond to positive news in the U.S market, the greenback strengthen facing British Pound. Markets now await the UK construction PMI data, which may offer some respite to the GBP highs, while a test of post-Brexit lows is inevitable as investors continue to fret over the Brexit process.
Trend: bearish
Key levels to watch: Daily PP 1.2869
First resistance R1 1.2871, R2 1.2911, R3 1.2944, R4 1,2990 H4
First support S1 1.2815, a H4 below S1 will trigger the pair to more drop into S2 1.2790, S3 1.2760, S4 1.2720
Remark: The bearish scenario is more preferable, a rebound could occur ahead of UK Construction PMI at 9:30 AM GMT (look forward).
For more in depth Research & Analysis please visit FxGrow.
Note: This analysis is intended to provide general information and does not constitute the provision of INVESTMENT ADVICE. Investors should, before acting on this information, consider the appropriateness of this information having regard to their personal objectives, financial situation or needs. We recommend investors obtain investment advice specific to their situation before making any financial investment decision.
FxGrow Daily Technical Analysis – 05th Oct, 2016
By FxGrow Research & Analysis Team
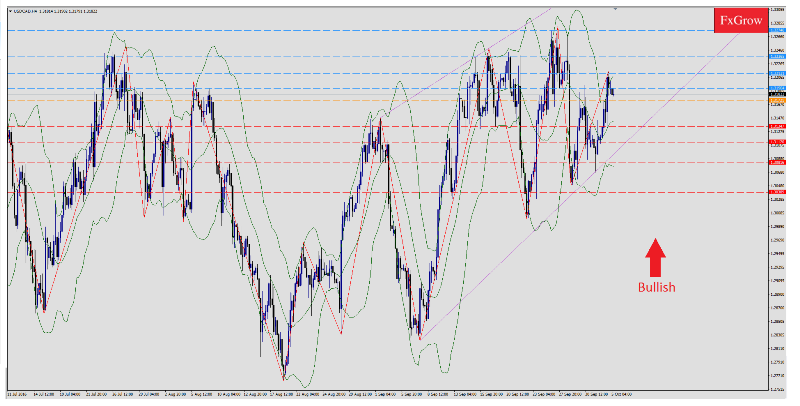
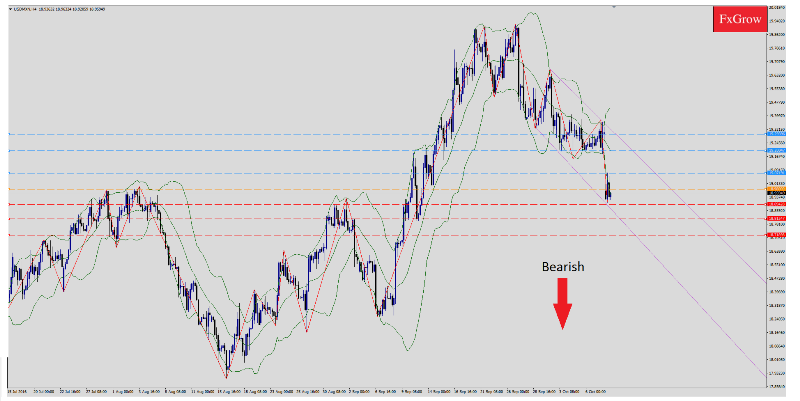
USD/CAD ROSE IN RESPONSE TO STRONG U.S DOLLAR
USD/CAD began a bullish trend yesterday rising from 1.3110 (low) reaching a high of 1.3215. Confidence in the U.S Dollar was restored yesterday as US data upbeat expectations. As a result, the U.S dollar was moving very strong facing pairs and commodities. Add to that, outlook signs suggest that the Federal Reserve might be closer to raising interest rates sooner than later. Today’s crude oil inventories and Canadian trade balance will either restore some dignity to the Canadian Dollar or the USD/CAD will continue its bullish trend.
For more in depth Research & Analysis please visit FxGrow.
Note: This analysis is intended to provide general information and does not constitute the provision of INVESTMENT ADVICE. Investors should, before acting on this information, consider the appropriateness of this information having regard to their personal objectives, financial situation or needs. We recommend investors obtain investment advice specific to their situation before making any financial investment decision.
FxGrow Daily Technical Analysis – 06th Oct, 2016
By FxGrow Research & Analysis Team
EUR/USD SLIDES BELOW 1.1200, AWAITING TENTATIVE ECB
EUR/USD dropped yesterday from 1.1233 clocking a low 1.1189 after receiving a positive news on the U.S Dollar. Traders were awaiting the German factory orders at 7 AM GMT this morning which came disappointing. As a result, the EURO continues to suffer facing the greenback. EUR/USD still has a chance to redeem itself as financial analysts awaits the ECB meetings results as they hints for rising Euro-zone government bond, and later on U.S payroll data due on Friday. These two reports will give a better picture on how the trend of the EUR/USD will move, also because there are crucial news on the U.S market.
Trend: Bearish
For more in depth Research & Analysis please visit FxGrow.
Note: This analysis is intended to provide general information and does not constitute the provision of INVESTMENT ADVICE. Investors should, before acting on this information, consider the appropriateness of this information having regard to their personal objectives, financial situation or needs. We recommend investors obtain investment advice specific to their situation before making any financial investment decision.
FxGrow Daily Technical Analysis – 06th Oct, 2016
By FxGrow Research & Analysis Team
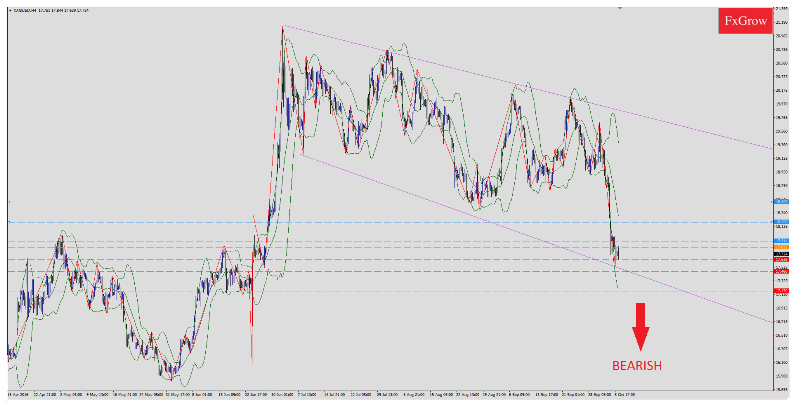
SILVER REMAINS BEARISH AFTER TUESDAY’S EXTENDED SELLOFF
XAGUSD started a dramatic bearish trend on Monday 3rd of Oct dropping from 19.31 (high) to 18.71 (low). Silver continued its bearish trend the following days hitting bottom 17.54, lowest since 28th Jun. The major drop is justified to positive news on U.S financial market starting by Monday. In addition to the increased expectations of a Fed rate hike by the end of the year given strong U.S economic projections. U.S dollar has been moving very strong against the metals awaiting further data to be released. Currently, silver is nearly unchanged at 17.70 an ounce. To summarize silver performance during this week, the shiny metal dropped this week from 19.31 clocking 17.54 lows (177pips). Tomorrow major news on U.S Dollar will give a wider image whether XAGUSD will continue diving or makes a correction and re-bounces.
Trend: Bearish
For more in depth Research & Analysis please visit FxGrow.
Note: This analysis is intended to provide general information and does not constitute the provision of INVESTMENT ADVICE. Investors should, before acting on this information, consider the appropriateness of this information having regard to their personal objectives, financial situation or needs. We recommend investors obtain investment advice specific to their situation before making any financial investment decision.
[B]FxGrow Daily Technical Analysis – 07th Oct, 2016[/B]
[I]By FxGrow Research & Analysis Team[/I]
[B]U.S DOLLAR EXTENDS MARKET DOMINATION STILL, SENDING USD/CAD TO 1.3252 HIGH[/B]

The greenback keeps a tight fist on the Canadian dollar for the 7th consecutive day pushing USD/CAD close to a new high since 24th march. USD/CAD opened in Asian session with a continuous bullish rise rallying from 1.3213 to 1.3263 high . Weak Crude oil inventories was not enough to interfere in USD/CAD bullish trend given that local Canadian economic data beats expectations. Right now, USD/CAD is trading at 1.3256 intraday and all eyes today first on Canadian Employment change and Unemployment rate, next U.S NFP and unemployment rate. This will create a battle between U.S and Canadian Dollar to decide which trend will take on.
Trend: Bullish
[B][I]For more in depth Research & Analysis please visit FxGrow.[/I][/B]
[I][B]Note:[/B] This analysis is intended to provide general information and does not constitute the provision of INVESTMENT ADVICE. Investors should, before acting on this information, consider the appropriateness of this information having regard to their personal objectives, financial situation or needs. We recommend investors obtain investment advice specific to their situation before making any financial investment decision.[/I]
FxGrow Daily Technical Analysis – 10th Oct, 2016
By FxGrow Research & Analysis Team
MEXICAN PESOS STRENGTHEN AS CLINTON TRUMP DEBATE ENDS
USD/MXN opened with -3% gap difference between Friday’s closing 19.30 and Monday opening 18.98 trading sessions. The Mexican Pesos ended a four weeks high against the U.S Dollar after Clinton V.S trump debate ended sending the USD/MXN below 19 handle. U.S polls survey ended declaring Clinton’s win after Trump vulgar comments about the women thus the USD/MXN slumps and currently trading at 18.94.
Trend: bearish.
For more in depth Research & Analysis please visit FxGrow.
Note: This analysis is intended to provide general information and does not constitute the provision of INVESTMENT ADVICE. Investors should, before acting on this information, consider the appropriateness of this information having regard to their personal objectives, financial situation or needs. We recommend investors obtain investment advice specific to their situation before making any financial investment decision.
FxGrow Daily Technical Analysis – 10th Oct, 2016
By FxGrow Research & Analysis Team
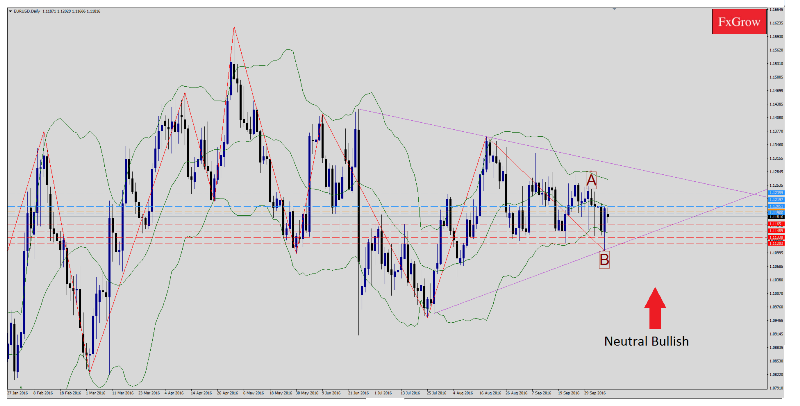
THE EUR/USD REMAINS TRADING IT’S WIDER RANGE AS BREXIT FEARS VANQUISH , EYES ON GERMAN ZEW TOMORROW
The EUR/USD tumbled on 3rd of Aug after good performance on previous sessions dropping from 1.1250 the highest level since October 3 to 1.1104. The greenback has received major positive shock waves starting by Monday, and extended till Thursday leaving the EUR in awkward situation as U.S dollar index kept rising. Even though the EUR received some positive news like German and French industrial production, the EUR/USD couldn’t find salvation and kept swinging into downward supports. disappointing US NFP data on Friday 7th pushed the EUR/USD higher given that US interest rate hike speculations faded. As a result, the EUR/USD took a hike rising from 1.1104 to 1.1205 (+101 pip).
For more in depth Research & Analysis please visit FxGrow.
Note: This analysis is intended to provide general information and does not constitute the provision of INVESTMENT ADVICE. Investors should, before acting on this information, consider the appropriateness of this information having regard to their personal objectives, financial situation or needs. We recommend investors obtain investment advice specific to their situation before making any financial investment decision.
FxGrow Daily Technical Analysis – 11th Oct, 2016
By FxGrow Research & Analysis Team
AUD/USD DROPS IN RESPONSE TO NEGATIVE AUD HOUSING LOANS

AUD/USD dropped from 0.7609 (today’s high) reaching the bottom of 0.7543 ( today’s low) on Asian opening trading sessions in response to -3% home loans that fell 3% in Aug, weaker than consensus (-1.5%), closer to TD’s estimate of –2.5% and July’s drop of –4.2% was revised to –4.5%. This was the largest back-to-back decline in 5 years. Although business confidence came positive but it was not enough to balance the equation. add to that the third American presidential debate gave positive shock to the U.S Dollar facing the Aussie.
Trend : bearish.
For more in depth Research & Analysis please visit FxGrow.
Note: This analysis is intended to provide general information and does not constitute the provision of INVESTMENT ADVICE. Investors should, before acting on this information, consider the appropriateness of this information having regard to their personal objectives, financial situation or needs. We recommend investors obtain investment advice specific to their situation before making any financial investment decision.
[B]FxGrow Daily Technical Analysis – 12th Oct, 2016[/B]
[I]By FxGrow Research & Analysis Team[/I]
[B]The British pound rose after Theresa May’s agreement[/B]

The GBPUSD surged this morning as the British Prime Minister May offers to make investigations as the market fears a hard BREXIT phenomena.
The GBPUSD rose mainly 2% to touch 1.2325 high but might follow a decline as negotiations shifts advantage toward the European Union knowing that May accepted to vote for the separation from the EU. Thus the GBPUSD might expand its bearish move toward 1.2022 and 1.1950 once it breaks the strong point 1.2075.
However, hard BREXIT risk might have receded as most parliament members see an EU friendly image and the GBPUSD needs to break the minor resistance point 1.2365 in order to pave its way toward next resistance levels 1.2405 and 1.2475.
[B][I]For more in depth Research & Analysis please visit FxGrow.[/I][/B]
[I][B]Note:[/B] This analysis is intended to provide general information and does not constitute the provision of INVESTMENT ADVICE. Investors should, before acting on this information, consider the appropriateness of this information having regard to their personal objectives, financial situation or needs. We recommend investors obtain investment advice specific to their situation before making any financial investment decision.[/I]
FxGrow Daily Technical Analysis – 13th Oct, 2016
By FxGrow Research & Analysis Team
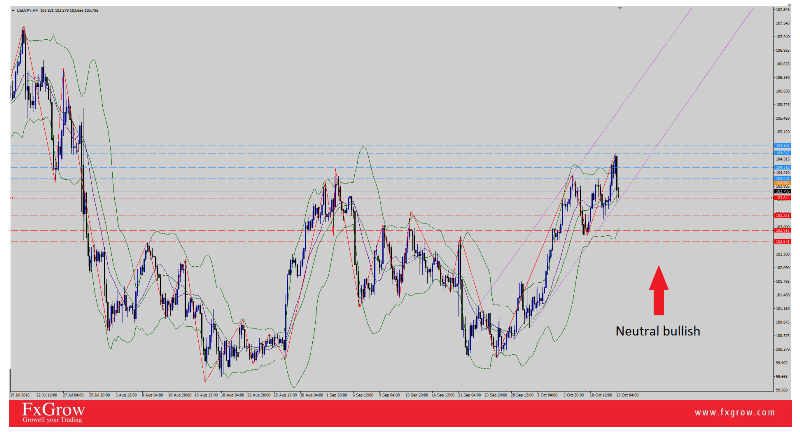
JAPANESE YEN STRENGTHEN AFTER DISAPPOINTING CHINESE DATA
USD/JPY dropped 90 pips on early morning trading sessions in response to negative Chinese trading balance.The worse-than expected Chinese trade figures spooked markets, and weighed heavily on the risk-associated space, causing a drop in equities and US bond yields thus surging the Japanese Yen higher. The Nikkei 225 index erased gains and now drops -0.30% to trade around 16,790 levels. Exports in September dropped 10% in dollar terms and imports fell 1.9 percent, with a trade surplus of $41.99 billion. Add to that a 0.2% increase in Japanese banking loads bolstered the safe haven Yen against U.S Dollar.
USD/JPY opened at 104.63 (10 weeks high) and due to the above financial reports catalysts, the pair scored 103.55 lows (-113 pip). USD/JPY made a tiny re-bounce currently trading 103.75 intraday, still managed to stay below daily Pivot 103.98.
Trend: Neutral bullish
For more in depth Research & Analysis please visit FxGrow.
Note: This analysis is intended to provide general information and does not constitute the provision of INVESTMENT ADVICE. Investors should, before acting on this information, consider the appropriateness of this information having regard to their personal objectives, financial situation or needs. We recommend investors obtain investment advice specific to their situation before making any financial investment decision.
FxGrow Daily Technical Analysis – 14th Oct, 2016
By FxGrow Research & Analysis Team
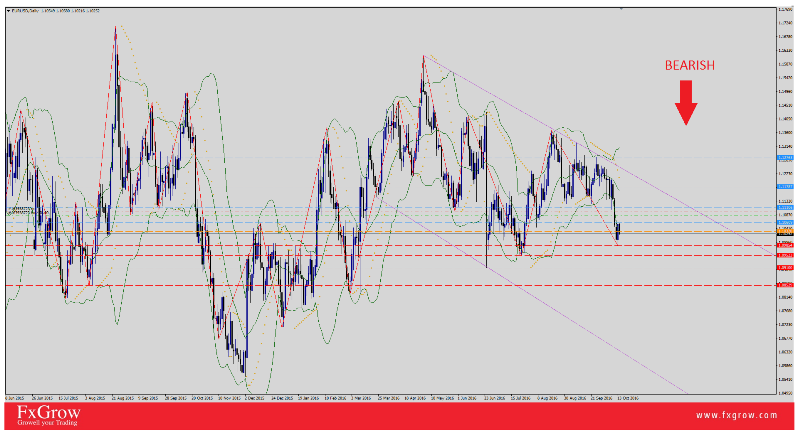
EUR/USD SINKS TO 8 WEEKS LOW, AWAITING U.S DATA, LATER ON YELLEN
EUR/USD dropped yesterday to 1.0985 low reaching it’s lowest price since July. The U.S dollar still keeps a tight fist facing major currencies, the US dollar index jumped +0.28% to fresh session highs of 97.82, heading back towards fresh seven-month highs of 98.12 reached a day before as the latest FOMC meeting released encouraged a Fed rate hike in December. The pair made a re-bounce to 1.1058 (today’s high) but then digested yesterday’s gains in Asian trading sessions -0.28% ahead of Yellen speech. Currently trading at 1.1024, still a bit below the daily pivot. The EURO is in desperate need for negative reports in the U.S financial market to make a correction to it’s usual position and today, we may witness this scenario due to crucial U.S news and Yellen speech.
The greenback picked-up significant strength facing its major rivals, mainly driven by a sharp rally in the US treasury yields, which suggest that a Fed rate hike in Dec is almost confirmed.
Trend: bearish
For more in depth Research & Analysis please visit FxGrow.
Note: This analysis is intended to provide general information and does not constitute the provision of INVESTMENT ADVICE. Investors should, before acting on this information, consider the appropriateness of this information having regard to their personal objectives, financial situation or needs. We recommend investors obtain investment advice specific to their situation before making any financial investment decision.
FxGrow Daily Technical Analysis – 14th Oct, 2016
By FxGrow Research & Analysis Team
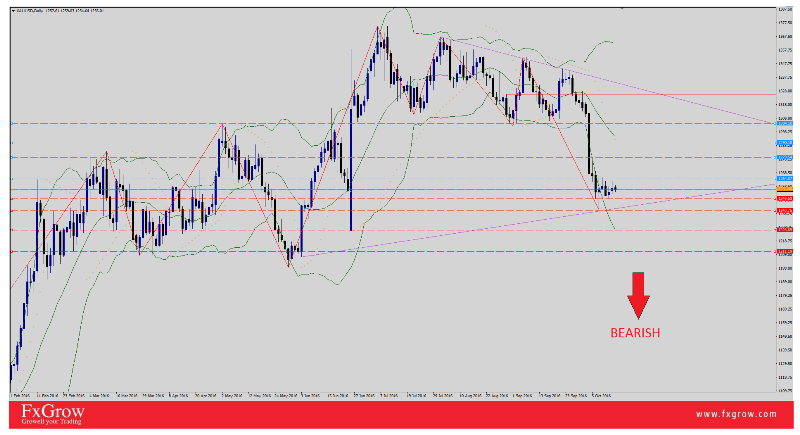
GOLD STANDS IMMUNE ABOVE 1250, EYES ON TODAY’S U.S DATA
Gold prices held steady on Friday after it touched 1262.34 high as investors remained cautious ahead of U.S retail sales and consumer sentiment data in addition to Federal Reserve Chair Janet Yellen speech due later in the day. Strong U.S. dollar weighed on the precious metal especially after increased probability of a Fed rate hike in December knowing that the safe haven metal is highly sensitive to interest rate decisions. Gold collapsed on Friday’s early trading sessions clocking a low 1254.64 as the greenback remains solid, currently trading at 1255.84 intraday. Today, all eyes are focused on U.S financial data, later on Yellen’s speech, where we’ll either witness gold going back to Sep and Aug highs, or price will tumble way below depending on the outcome.
Trend: Neural bearish
For more in depth Research & Analysis please visit FxGrow.
Note: This analysis is intended to provide general information and does not constitute the provision of INVESTMENT ADVICE. Investors should, before acting on this information, consider the appropriateness of this information having regard to their personal objectives, financial situation or needs. We recommend investors obtain investment advice specific to their situation before making any financial investment decision.
I can no longer read the price on your chart. All those crazy lines and indicators are in the way!
Yes, of course it’s bearish. You can see (barely) that a lower low is likely to form at the trend channel line. Unfortunately, it’s hard to see because you have so many lines on the darn chart!