Is cable joining the party?

I’m looking at EURUSD 1HR and it looks like distribution in the form of a H&S, so yes shorts now probably.
Hi Pete,
I am at pg 40+ of this thread. Long thread to read thru. 
I am testing myself to see if I understand the logic of volumn, apparently, I am not there yet. :8:
I did a long trade for AUD/USD. Pls see my chart. Did I get in too early or I was all wrong?

Here’s my take, nothing inherently wrong with the trade really, I would have had stop at BE at least, but when you say in too early - I’d say, probably since the market doesn’t really move at that time of day, I think your chart is on GMT or GMT±1.
It might be an idea for you to stick to the EURUSD for learning, you’ll get a much better response since we are all quite familiar with what’s going on with it.
Could have have been some distribution/supply, but nothing about this chart says its in distribution phase. Only reaccumilation.
Of course, the range is too narrow, I’m getting there.
…as Purplepatch said.
There can be no distribution phase with out stopping Volume on an up move first…and that’s really talking about the 1hr. I don’t think any VSAer would argue that.

Thanks for that, it’s all coming together now.
Not to me. It actually tested an area of demand…NS aren’t found at the bottom, pins area. There you are looking at demand.
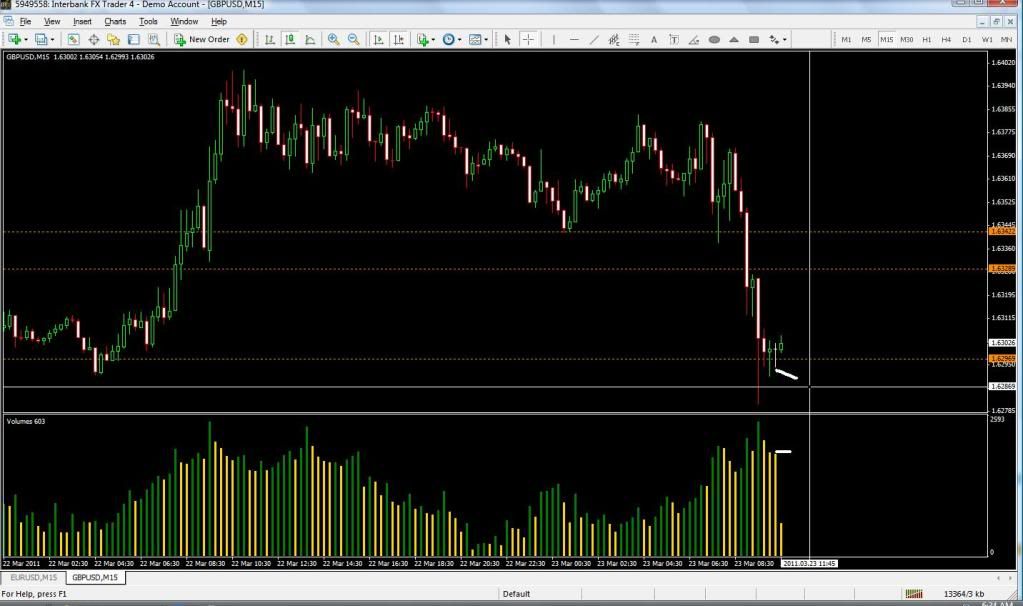
I don’t consider dojis or stars to be ND or NS’s especially that one on the above chart. That was an indecision bar to me and wouldn’t have indicated strength or weakness to me. . ND’s and NS’s are all over the chart but the background is what gives it importance. I don’t have access to print a chart right now but if you look at the E/U 15m… Notice during the significant down move there was in up bar (12 GMT). Professionals withdrew for the moment (didn’t keep trying to push it so no wick), the volume was less than the previous 3 bars as price closed on its high indicating no demand. Perfect for a short.
Yes. ND’s and NS’s are for the most part continuations of a trend. Wicks test areas for supply and demand and use them to wait for a sign of a reversal.
Is the box in blue a no supply? if so, wouldn’t this buy stop be the correct placement and order to place based on VSA?
Here it is. Perfect example of ND. On another note, I think this down move is going to be short lived. More recent signs of strength than weakness. Waiting for price to get above 1.4143 and test it before going long again.

can you explain why you think that? talking about specific bars ect. I’d really appreciate it I am starting to pick this up more and more but I just need more confirmation on things.
Thank you Ken… Saved me the trouble of what I was about to do. Thats a good example of a NS in the wrong spot. Directly behind it is a significant down move with a bunch of weakness. Wait until that area is test for demand. Twice, maybe even three times or some stopping volume. The best NDs/NSs to take are these (imo):
Wait for a widespread bar to confirm strength or weakness has entered with volume. Within 5 bars, you should have a narrow spread move in the opposite direction with volume less than the previous 2 bars. The lower, the better. I’ll consider the entry void after 5 bars. These almost never fail me.

Highest volumes of the week pushed price up with the exception of a fight today with the bears and bulls. If it can’t break above .4150 then I’ll start looking at some short-term shorts.
I think they might be gunning for 1.4040-50. I’m planning to wait until there before going long again anyway. Though having said that I’m not confident enough that it will get down there to try and short it - the odds/value don’t really work out.