Here you go Pete:
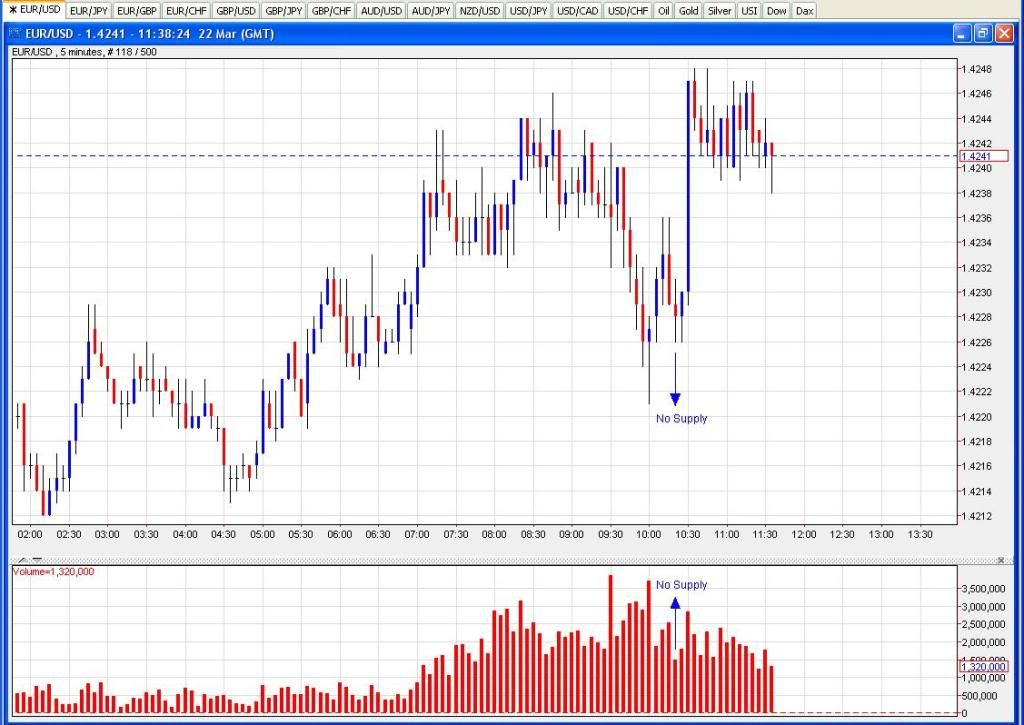
Isn’t it just, I was about to post it myself, but I started watching Victor Meldrew on the other channel, it nearly cracked me up as much as people accusing us lot that use the volume indicator to trade is silly, highest volume of the day followed by an NS for a neat scalp, of course I must be delusional and seeing mirages.
Haven’t done this for long time… But I’m posting here that I’m long. 
If price starts to go up, I think it will go to that 1.4300 in couple of days or something like that… Now there is 2 different ways that approves that. Only if this one hour candle gives inside close and nothing unexpected happens…
Was looking at the same thing. Price is hanging around a 50% fib with some stopping volume. Just waiting on the proper set up. It’s also bouncing off the previous week’s high acting as support.
I have been reading this thread now for quite some time and I understand most of these concepts pretty well I think. The only thing that I have not been able to wrap my head around is how do you draw your fib levels? Like do you look at the 1 hour chart and go all the way back to march 11th where the price was way down to 1.37516 all draw it up to its most recent high at 1.42477? Or should we be drawing the fib levels on a smaller TF?
Yeah it would seem strange if, having gotten this far, they couldn’t force their way up for a test of 1.4280. Guess they might want to have a drift back and check selling interest at the 1.4150 support level from a couple of days back first and maybe shake out a few of the weaker longs in the process.
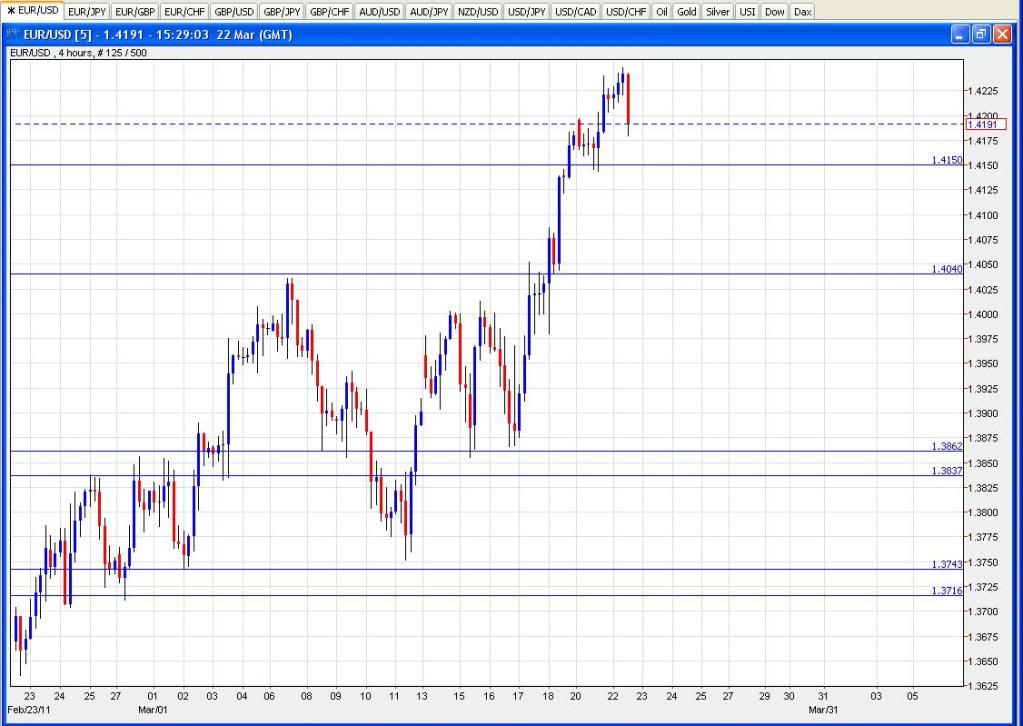
I usually use the 1H or 4H and take the Fib from a clear swing point that occurred during a particular session. On the 1H the NY session low occurred at 1pm GMT and provided the start point with the recent high at 1.4248 providing the endpoint.
You can also try to combine a few Fibs together to see if there’s a confluence in a particular area. Personally I don’t go with that way so much - I prefer to just use some horizontal lines on my charts (daily and 4H) to identify zones which have been clear S&R zones in the past.
Great, thank you for this information. I will put this to the test.
Made another 3% today using this method. Would make a lot more if I had the nads to let the trades run. Nice bounce in that EU a few minutes ago after stopping volume.
Short term targets right now are: 1.4232 and 1.4264. Those are based on this new thing I’m trying out.
Hey Nero, good stuff man. I actually saw the price starting to move so stayed around (a bit late to work btw) to take this trade as well… after that large stopping volume. Got in around 1.4196 and currently have my SL at 1.4170.
My question is if you’re targeting 1.4232/1.4264 levels (am looking at 1.4240 myself), where is your SL located?
Check that. On to the next one 
Ok, how do you know the difference between these things
A no supply Vs. no demand IF they are a very low spread doji or star (price ending in center)
These seem to forshadow greatly a price change
This for instance, its wick is as tall on the top and bottom. So what lets you know which one it is. I have learned alot more about this method and I’v been researching before I ask but theres hundreds of results for a search just in this thread for no supply and none of them answer my specific question.
Definition of a NS bar is that: a low spread down bar with volume less than previous 2 bars.
The close of this bar is not so important but if it forms a doji-type of bar with wick on bottom and close higher than previous low, it’s a bit better… Entry would be one pip above the high of this NS bar.
Remember that background is much more important than a NS stand-alone
Hope it helps a bit 
E/U has a perfect setup now to bounce…let’s see if market behaves.
Looks like it! Previous’ day low with all this background supporting accumulation.
Let’s see how it goes. 

Thanks for the chart so I can be lazy. That fake break of support, aka Wycoff spring, usually results in a nice up trending move. Besides that there is nothing but strength in background…even saw NS before the drop, indicating it was a BS shake out. Dare I say this is a perfect setup…so about 90% chance of success lol…cause hey, market can still stop you out and won’t owe you any explination.
Edit: Notice the straight 30 pips profit, no draw down if you got in after stopping vol inside close, or waited for push through supply even. I took a bit of profit off and locked BE as it attempts the markup now, and that could fail. A small 61.8 level here too at 1.4191.
I’ve been having a long time of lazyness in this forum as of lately, lol, so a chart is no big deal.
Fiber has been like crystal clear recently, so as you have pointed out in this thread several times, having your key levels well indentified beforehand should pay out nicely. The beauty of this is that if SM needs to make a further markdown, the initial bounce will be good for a break even trade.
As of today’s trade, I think it could well be marking today’s low (I wish, lol), but, well, you know, what the market gives about what I think!
Agreed, probably todays low…besides a news BS move down maybe. The chart is saying clearly to me, that this is the start of a final push up where we get stopping Volume and a real down move. Could be at a fake break of the 1.4250 high, but stopping Volume on the 1hr will mean more to me than price.
I might be wrong, but I think it still has potential to go up at least at 1.4213.
Price broke weekly MR1 and established a range between that and the central pivot. My guess is it’s testing weekly MR1 as support before reaching for the stars. I see no stopping volume there, so I think we could be building today’s range.