Volumes were good enough for me to have a wager that the dip buyers at 1.4050-60 were still active enough to support that level. Once it seemed to be case it went up in on time. Closed out at +30 pips. Not going to wait around to see if 1.41 can be broken.
I didn’t like it, it was a case of let sleeping dogs lie, I got about 25 off of the ‘first wash’, but the first was so obvious, I just can’t understand why traders dismiss this strategy, I just don’t get it, just because it’s not ‘real’ volume.
Well, I read an article about some of the best science recently, not forex science, just science in general, I think it may have been Brian Cox, it/he said something like that you can’t actually prove that gravity exists, but what you can do is test it time and time again, i.e. drop something and it will fall, there is nothing in science that says it will never go up, to me it’s the same with forex volumes, you can’t prove that it is fundamentally correct but, time and time again it works.
Look out for those peak volume dojis, stars pinbar, call them what you like, understand where and when to trade them and well…
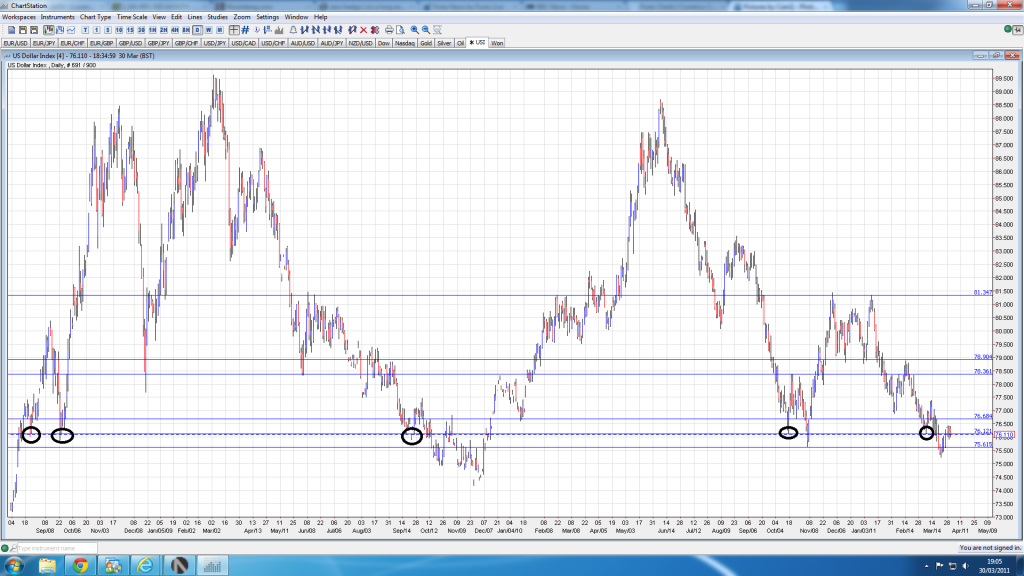
A bit unrelated to vsa but I would like to say bye bye to USD for now. Usdx chart

More not related to vsa, but something to note. Chart on EG, currently testing tl, with usd going mental. Is it implied gbp strength next few days…

Luiz - in relation to the DXY I wouldn’t be so quick to write it off. If you look at the DXY chart since Aug '08 you can see it’s at a level now where there’s been a quite strong reactions to in the past. For the past couple of days we’ve only managed to wick below the level and we’re right at it again today. I’d probably wait to see how it goes over the next day or so before calling a big dive in the dollar. If traders want to look past the EU debt problems it’ll happen given the weighting of EUR in DXY.
Hi PB
You are right, usdx is at strong demand level right now on weekly chart. As for my last post, it’s 1 hours chart, so, it’s my view for next few days. For long term, I’m also bearish on usd as you can see my chart on usdx in my previous post few days ago. I don’t really into fundamental, so I don’t know :d
As for today, I hope Gu close above 1.6040
Hope it helps :d
ok, if you look at USDCAD on the 5min chart you see the highest volume for the day on a bar that has very little bull body, and a tall wick on top and bottom. how should this be interperated?
Also, E/G tends to track E/U. When one goes higher so does the other typically and vice versa. With both appearing to run out of steam at the moment this could be an indicator that the dollar could have a turn around. ECB have been out all week hinting at a series of rate hikes over the coming months yet it hasn’t been enough to propel the Euro to break past 1.4280. Then throw in all the Fed talk about letting QE2 wind down and there’ll be no QE3 after (for now) and that might help the dollar some as well (and has been this week). Just something to keep an eye on anyway maybe.
Thanks pete for great way of trading with volumes when combines with other indicaters it gives marvellous results i been trading it for last three days and so far so good cheers

Think I got mixed up on the wrong end of a couple of month-end / quarter-end flow trades for -0.8% today. Reckon I’ll sit the rest of today out and just watch where things go. Been pretty choppy so far what with the thinned liquidity.
Took one trade today, let’s see how it play out. Target 1.6120

Edit: Out at BE, mmm…
Had a good day today with AU and CAD. +5%.

Here is what I took today. Basic stuff. It was little better than basic, 'cause price went in old resistance lvl, which started to act like support lvl.
I closed half in that red circle. It was 50-61.8 fib area, so good place to do it… Locked BE there too, which got hit little later. Not really the best trade ever, but I take what I can get.
Hi Pete, where can i find your chat room ?
Beautiful long on the GBP about a half hour ago. Triple bottom on the 1 hour off of a fib. Doesn’t get any better than that. Apparently nobody makes money in forex. 
Check out this on the 15 min GBP. High volume down bar triple bottoming out on previous weekly low which is also a fib on the hourly. Pin bar on hourly at this point, too. This is about a 99% successful trade in my book.
gbp.bmp (618 KB)
Happy weekend everyone Hope everyone has a good one and a good April to come.
@Max: You can add Pete’s skype to ask about his trading room. One of the best 
Thank you luiz. Have great weekend and lots of pips in the next week
Where do you follow his trades? I’m really interested to understand this strategy
Some food for thought next week  Below is the compressed chart of EU on daily

EU is facing major test @ 1.4250 which it fails a few times in last couple of weeks. Given it successfully pushes through 4250, another major test appear: Old high @ 1.4290 in November 2011, down trendline, psychological number 1.4300, mmm
Given it successfully breaks the old top n down tl, next resistance could be 1.4500 and 1.5000, hmm.
I expects a down day on Monday to clear the aggressive upmove of last Friday, also shake traders out, then steady move up… My crystal ball lol
Better view, we r nearly there. A push through is all it needs

Guys what our the settings on the session volume indicator