I use both IBFX and Go Trader and the volume feeds are very similar.
Thanks for the responses, I’ll try to post some pics to be more specific but still wondering about the candles, because they match on the 1 min, 5, min, and 15min,… but are way different on the 1hour 4 hour, and daily charts between Onanda MT4 and IBFX MT4 … so I’m thinking the volumes they show are different (edit: obviously the volumes are different but maybe not an acurate comparison if candles are differenet?)
Edit: See picture. (check my paint skills :27:)
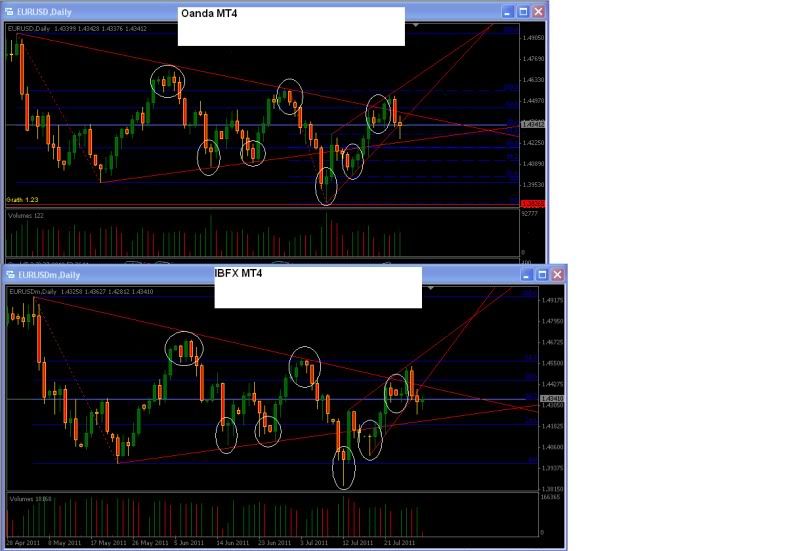
The 2nd circled (around June 15), IBFX had an issue with their feed. As for all the other ones, they will always be different depending on the orders they process.
Gidday,
This is my first entry into this thread following Pete`s Madscalper thread.
So, to begin with I`d like to say thank you to him for his time and effort in starting these and showing me the light with VSA.
I`m still only half way through reading this thread and have read ‘Master The Markets’ as you do!
I saw this trade yesterday on the AUD/USD.
After following it down for a 130+Pip Short Trade I noticed what I thought was large stopping volume and then entered for a long at the close of the red vertical line up bar.
I exited the trade after it bounced off the 61.8 fib.
Would anybody like to confirm that this trade was appropriate.
Thank you
Regards
Stephen

Didn’t take no trades today. Only got a chance to glance at the chart a bit at NY open. But the chart obviously said it was going up.
But that A/U entry was perfect. Waited for news to pass and saw momentum gaining upwards.
Look at the E/U 15m chart. Clear buying in London. Shakeout. Accumulation and another shakeout (this shakeout was the biggest clue with the squat bar following) before going up.

yep i am slowly getting the picture on this method. it is a bit different from what we are used to. it is not standard textbook babypips as volume is rarely covered.
re: AU entry, i notice the volume bar was down when it was going up. what does that indicate. is the red vertical line the entry trigger. thanks.
"
But that A/U entry was perfect. Waited for news to pass and saw momentum gaining upwards.""
re: EU setup, i notice some clear accummulation and some shakeouts. which point do we decide to enter there, right on the breakout.
Thanks EnPoint for your feedback muchly appreciated.
I`ve had a look at the 15min E/U and I understand what you have pointed out.
It is a nice example.
What is the squat bar? Is it the first blue bar following the 2nd shake out?
Regards
Stephen
Hi Halba,
Firstly, I am no expert at VSA. I have only been learning this for about one month so I really can`t give you much advise. There are more qualified people on this thread.
I entered the long trade when the up bar closed, marked with the red vertical line. The volume then increased after this for a short time as it travelled up. I thought that there was strength behind this long because prior to the rather large stopping volume at the bottom smart money looked as though it had been distributing.
Again, this is only my opinion.
How I see the E/U. There was a test a few bars after the second shake out which did indicate that there was only a small amount of supply left in the market.
Following this there was a wide spread up bar with huge volume. I would have gone long on the close of that bar.
It just so happens that the next bar was also huge in volume and went up, up & away.
Just my opinion.
Regards
Stephen
(AU) When volume drops like that, smart money isn’t making any moves and you can see where the path of least resistance is. Its always good to put an order a few pips above the high to let the market fall on your order.
(EU) Yes, the squat bar is the blue one. A squat is defined as a bar thats in new low/high ground with volume more than the previous bar with a narrower spread. Thats an aggressive entry and I’ve been known to take them but the safe entry is the red bar, which is a No Supply bar. Its also followed by a couple more.
this is a solid method imo. its totally a new concept, it looks like it produces good short term trades.
i took a short trade on the EUR following the same principles - high volume, slight breakout, no interest volume in bidding higher earlier(1) at significant resistance, and marked higher volume bar on the slight break down.
also i am shorting after it has gone up for two sessions.
and it dropped like a stone.
this has a lot of potential. is it luck or a fluke? probably not. you need to combine with S/R, pivots and what its done during the day wise.
pretty good strategy.
it dropped over 200 pips since i went short
Hi everyone
E/U long perfect setup right now?
No, the move is done imo, high to low is 200 pips today, its average is around 150 pips last few weeks, so when it finishes its daily average, I’m just normally stay out till tomorrow
thanks luiz
was that a valid setup?
May you post a chart with your view?
sry but i think i need to spam more
cheers thanks luiz
so from what i understand now we are in reacumulation and i should look for longs.