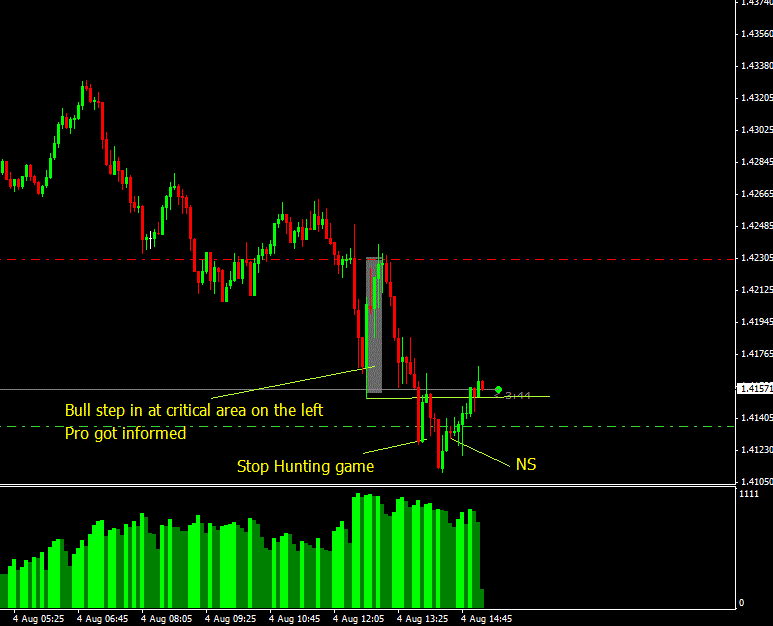
Yes, that’s what I’m doing
But to be able to see price action with volume in harmony requires a great deal of time and effort to learn, so do read the thread and Master the Market a few times, then watch the chart, try to explain why price and volume acts such a way. With time, you’ll get the feel of it 
We’re entering an area of high volume reversals from the last few days…
Looking for long opportunities on the 5m chart.

Update:
Well that was quick!

Edit: It seems the forum has changed and no longer allows has the option to “click to see higher resolution image”, so I’ll put the image links below…
luiz i did read this thread twice and also master the market twice but you are right i have to re-read them few times more.you told me yesterday that we are in reacumulation but today market has dropped much.can you please tell me why has gone down cuz as i see ( like a noob see ) there was no distribution ?
thanks in advance
Hi lebanner, nice to have you. Remember that SM is greedy like hell, they always go for stop-loss to increase liquidity, also trigger limit orders of informed traders. Here’s my view, I’m already in long, SL at BE. Let the market decide
I agree, didn’t see much distribution when the price reached upper levels. When entering the market with such large volumes, it’s hard to get a good price without affecting the market. This could explain why the distribution didn’t materialize, they were waiting for price to go back down (which it will eventually, since Smart Money isn’t pushing it higher), so they can re-enter at a better price.
I am expecting price to go up, but I’m not sure if I would’ve entered at the same NS as Luiz. We’ll see if it pays off 
Edit: Picture added

Thats brave - aren’t we in a general downtrend on the euro/usd anyway
One thing I’ve found that makes it a bit difficult when looking back at the chart, is I feel that I’m missing information. Candlesticks only show us 4 pieces of information about the timeframe:
Open
Close
High
Low
Volume helps tell the story here, but I’ve found that when I’m able to watch the candlesticks LIVE, it helps me determine what the volume was doing. Since I can’t always watch the candlesticks live, I use the strategy tester to fast forward through the last few days worth of price movement to help with my analysis.
Here’s a quick video I’ve made of the last few days worth of price movement. Using this I can see the velocity of the price movement when entering the gray zone in my screenshots above, along with the price movements in the box I highlighted above where I noticed there wasn’t much distribution…
What do you think?
HOw do you run a backtest like that dodge?
Hmm, just broke through the 68fib, at the lower end of a channel. Still waiting for the long, none of these moves have been high volume at all.
4HR chart

1HR

5m

Possible turning point here, but I’d wait for some more volume to enter the market before going long.
Press Control - R to open the Strategy Tester, click “Visual Mode”, Select an EA along with the time settings and period, then click play.
Was asleep at that point - but there wasn’t any volume at the bottom over the asian session - is it going to wait for the London session before going up
Thx Luiz. Hope you guys dont mind if i ask some questions sometime.
From what i understand this should be a valid setup.Stoppind volume on 5 min with pin rejection on fib 50 on 15 min.Pls correct me if im wrong.
Edit: Pls someone can tell me how to attach a photo?
Here is: thx goldenmember
http://i54.tinypic.com/wjv329.png[/IMG]
use tinypic - upload and paste img
I think this might be a valid long:


Hi All,
Just thought I would post this long trade I did this afternoon. The AUD/USD has been coming down on the 1hr T/F. I saw what I thought was a bit of stopping volume on the 5 min T/F with a nice entry (aggressive perhaps) following the down bar at the first vertical line. (almost no supply)
I exited the trade for 38 pips when it bounced off the 61.8 fibb. Any comments would be appreciated.
Regards
Stephen
Analysis. I made some money from #2 to #5, with a big SL as the close below 61.8 indicated there might be some selling pressure left. Then went short at #8, exiting at the pivot line.

Update, it took so long to type the market already reacted to my screenshot 

Looks like an aggressive/risky trade, as the candle you entered on (almost no supply) showed there was still some selling pressure left. Glad it worked out for you! 
Thanks for the feedback Dodge.
In hindsight I thought it was too aggressive. Glad you confirmed that. I`ve got a long way too go.
It is a sharp learning curve.
Regards
Stephen
Risky scalp long

Edit: Definitely looks like stopping volume on the 1HR chart:

Edit: Hit SL. While I think it’ s a fake downmove for big money to get better prices for long, I don’t want to suffer the drawdown.

