If it’s profitable for you I’d suggest to do that as well. Albeit, what you see then is in realitly not a climax. At least not for long. If you have really a climax then there is no other way than maybe a little more going up or down and then a reverse is very likely. That’s the definition of a climax. There is simply no more demand to drive the price higher.
Another thing to consider in reversals is that tops or bottoms take some time. Usually, the first top is not the best top to grasp for a short trade. There are often double or triple tops and with the last top the highest price. Market makers like to drive stops there and put the impatient folks into weak early trades and later run their stops.
Anyhow, what I can see the best setups are those where you have a climax on top, a nice tl bounce, a hs pattern or something like that and price dropping below the shoulder after the whole pattern can be seen. That’s what I’d consider a high probability setup. Look at the s&p weekly chart, zoom out and you will see what I mean.
Of course it is not a climax, but I tend to call it that way because it is shorter than explaining what I have in mind. I can see you understood tho. In a down trend I would look for short reversal ending with big high volume upbar suggesting that SM dragged the price up just to sell little more into the down trend. That’s where I would go SHORT. For LONG it is the exact opposite.
I realize that but it is really hard for me to tell what is the REAL top… That’s why I will be avoiding those setups for quite some time. Like last week… Euro was dropping on those huge downbars with extreme volume and I went long two or three times thinking that THIS must be the REAL SELLING CLIMAX, only to lose three times…
And you are right again, climaxes with some sort of STRONG confirmation (VSA conf, patterns, pivots etc.) are not a bad way to trade, however, in forex the price sometimes shoots in some direction without any confirmation what so ever and that’s where you would miss out with this kind of strategy.
I personally don’t have a “plan” the way you put it. The only thing consistent from trade to trade is my SL being -2%. Besides that, everything is up to my analysis of what I’m currently seeing. One piece of advice I can give you, which I think you’ve already acknowledged, is to take fewer trades.
Personally, I try to limit myself to one trade a day. This allows me to easily pass by any trade I see that doesn’t immediately jump out at me. Afterall, if I’m only taking one trade a day, I should only take the best setup possible. Once I got into that mindset, it was easy to pass-up the “almost” trades.
I was thinking the same thing Dodge. You can’t really plan VSA. I read my post again and the part about early trades and bad setups stuck out to me. One thing everyone one of you seem to do is wait on the trade to come to you. I wake up in the morning, set down, and look at the volume and bars trying to find a trade. I thought I could take all this new stuff I have learned here and apply it the “method” I have been using. I guess thats just new trader mentality and I’m gonna have to force myself to change. Develop that mindset you talked about Dodge.
So, I believe my plan doesnt have to cage the beast that is VSA. Instead of carpet bombing the chart, and my account, with VSA signals, I need to zero in with a precision guided missle like you guys do, and then strike. I need a plan that tells me when and where to apply VSA. Thankfully, Pete and you all have takin all the guesswork out and laid out many good places to watch. And I hear you screaming about trend continuations Purplepatch. My favorite trade is a no demand at the top of a rally. I have a harder time with no supplies and tests though. I like shorts much more than longs.
I’m glad I found VSA so early on, but it would be so much better already knowing important levels to watch and have confidence in. So I will follow the lead of this thread and watch 50/61.8 of the hourly, the hi/low of the day/week, and trendlines. I also dabbled a bit in market profile and so many times I saw price touch a point of control and reverse, so I will watch that as well. Im not so confident in S+R 1,2,3 but I do see price turn at the daily pivot a lot. So what happens when you have done your homework at night, and then price does something totally different, or goes right through the levels you pointed out? Just apply all your normal work to the new move? Or get in on a pullback if it goes through? Guess those are obvious answers, but Ill leave the questions anyway.
Well, thank you guys for your feedback, I will focus much more on self-discipline, and applying what you guys have taught.
Well, I guess the difficult part is to recognize a climax and differentiate from market strength. Both has an increasing volume signal. A climax is just too much volume, while the market strength is high volume, but not too much. The spread in this case or the other could be the same. That makes it very difficult to look for a real climax. You will probably get too many fake signals then. That’s why it is important where to look for a climax signal. Not at the bottom or in the middle of a trend channel for a bullish climax, but at the top. Vice versa for the bear climax. Plus then if might be good to just recognize the top and enter later if you have some other confirmation. What I can see here in general is that even on my M15 chart with a lot of vsa signals coming in those climax signals are rather rare. That’s probably the reason why I see more good climax signals while not seeing much fakes.
I don’t quite understand what’s happening on EUR/USD. The price has just continued through the daily low these latest days, why aren’t there a markup? Can anyone explain this phase?
I know there are traders out there that will offer an opinion on this, but personally I don’t concern myself with that kind of stuff, I just wait for my setups and that’s it.
Probably because the people with deeper pockets who will be doing the markup will be looking more to play the range that’s been in place for the past while between 1.40-1.45. I would expect to see a lot more interest at the 1.40-4050 level.
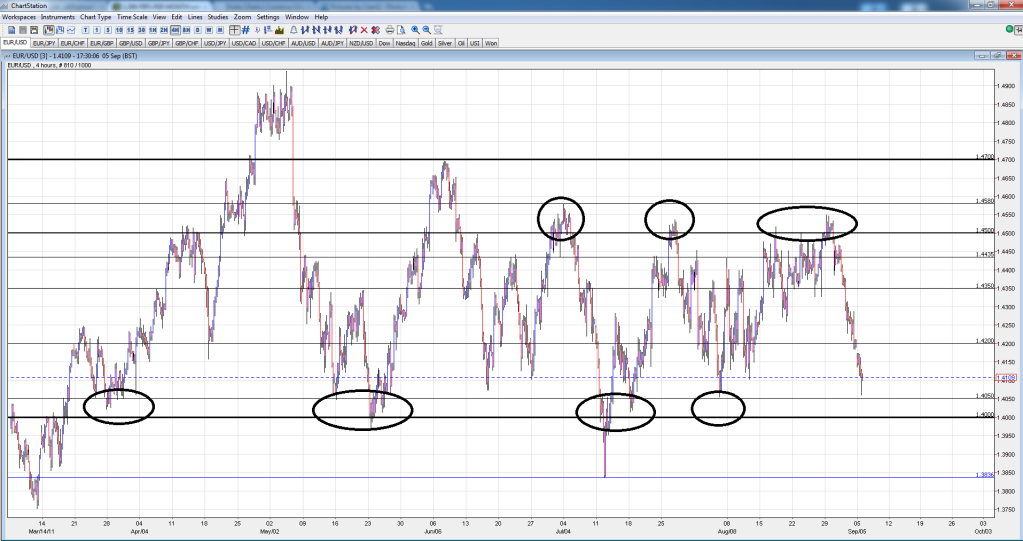
Well so much for following the trend. I actually went long today on E/U. I have seen some buying climax and stopping volume on my support line (PipBandit pointed out those levels). And I pulled the trigger for 2% SL (35pips). I was very lucky with taking the profit as you can see. Red circles indicate where I’ve entered and exited.
I guess there is not a lot of VSA principles behind this trade. I have simply noticed increased activity around support level and tried my luck. Not very proud of it.
You can also see SessionVolume all shiny and beautiful and I must give million thanks to PurplePatch for this absolutly stunning indicator. I recommend it to all the readers of this thread. It may help you more than you’d ever imagine at first glance! … Oh and the prediction of the volume bar height long before the actual candle closes… Oh my jesus, just try it… :13::57:
Well well, thank you, always nice to receive compliments, but it is handy isn’t it, but it’s surprises me how ‘accurate’ the prediction is, it’s just a basic pro-rata calculation, I trade the 15m and about 3 mins in it gives a good prediction, I find it most useful to trade high volume breaks of S & Rs.
Hey guys i have some questions for you, more experienced traders.
All the serious brokers are market makers; that means we are trading with them, not between us. How on earth should i read the “volumes” bar since it actually is a sum of price changes during a given period of time?
I have 5 demo account on different brokers and each one has diffent quotations (though close together) and very different volumes. This tells me it is somehow related to the peanuts were trading, but when it comes to a professional trader (assuming the best best case scenario, meaning it is not the bank or the broker itself, only a level 2 trader) it can trade a huge volume with one visible tick (worst case scenario no visible tick ar all). So is it just me, or we are trading absolutely blindfolded?
I know that in theory the market maker offsets our orders to the bank behind it and therefore the quotations, but i think its decent to assume that it has a buffer system to cut costs, protect against sudden moves and remove useless orders (such as a traders that becomes broke half an hour later).
This question rises every now and then in any thread related to VSA in forex. This is no expection of course. Therefore you would find your answers in this thread.
Anyways…
[I]Tick Volume isn’t real volume and has nothing to do with the volume of the actual money traded…[/I]
Yes and no. The first thing you need to do is realize what does VSA use the volume for. It uses it to determine an ACTIVITY at the particular bar. More volume means more activity. The same way it works for forex. More ticks, means more activity, because the price changed many times. I don’t know the exact process of how the SM get’s their orders executed but I assume that when there is a lot of SM involved, the tick just goes up and down and the Tick Volume rises.
To be more scientific and less common-sense minded… There has been a study about Tick Volume and real Volume correlation which you can find over here. The results show that Tick Volume is accurate enough to trade it on 1H chart. (probably not only that)
And the last but not least… This very topic is a great proof that VSA in forex works. It starts witch amazing trade setups by Petefader and continues with many other succesful traders trading different VSA methods and strategies.
[I]Tick Volume differs among brokers…[/I]
Yes it does. But the extremes are usually very similar. And that’s all we really care about. We always compare Volume bar to another Volume bars in its close distance. Therefore it doesn’t matter what the actual volume is in exact numbers.
Well, i’m not trying to say that “VSA could work if…”, i’m trying to find some answers to questions regarding my money. The way i see it, volumes should be common sense approach since it actually drives the quotas (i work for a retail chain, in the financial departament).
That “study” seems to me a brokers response to increasing consumers awereness, not to mention the middle page large blue letters postulation, an answer to a question we never ask - were not talking about FX volumes but about our small internal market in which volumes are known on split second basis and probably our behaviour is studied so the broker knows accurately if an individual will open and when will close given a specific situation.
I you take a good look at the volume/tikets chart, there is absolutely nothing that could make you tink you can figure out a correlation; further more, there is no esignal/hotspot/volumes/ticks chart over there.
So if any broker is or partenered with a large bank (Citi, DB, Goldman, UBS, ABN Amro, etc) and the quotas are very similar and move the same, i must assume that we as retail traders cannot support any price level at all so feeds are coming straight from the IB market and the ticks are related to the number of transactions between large institutions on the open market so trades we make are only a result based on thinking that other retail traders generate the ticks. From time to time someone collects our money, when we see those sudden spikes on low ticks - i must assume that a large trader (level 2, the broker or the bank itself) takes an opportunity.
Some questions arise from here: are large players level 2 traders? Who are they on lets say oanda.com? No dealing desk involved in our transactions really means that the broker is not an active trader? Do the banks behind the broker trade, or it is just building up market share for the glorious fx times ahead?
We are all on the same side here so i think that if we could figure this out, we have a real chance of trading successfully.
P.S. I am not saying that you guys don’t trade successfully, I am trying to figure out how could i do it too - and using a volumes technique without having volumes is not an option for me.
Very often there just aren’t any answers/proof, it’s somewhat like what happens in the Science Community/Industry, a lot of theories don’t technically have direct proof or, but by continuous observation providing the same results time and time again it is accepted as proof.
For instance there is no proof that gravity will pull something towards the earth, but since it has been observed millions and millions of times over it is accepted as proof that it always will, it’s kind of the same with VSA, we have observed the same setups over and over again and they are profitable.
Personally I don’t think it’s a good idea to think too much about Forex stuff, I just accept that this stuff works and it does, that’s all I care about, I don’t give a hoot if Bernanke or Merkel or Obama or Cameron or anyone says whose buying what where and why, I actually try and avoid it, I really don’t have much interest in the currency market like that, and I don’t need to.


 … Oh and the prediction of the volume bar height long before the actual candle closes… Oh my jesus, just try it… :13::57:


