Yep, usually very slow. I take off the last 2 weeks of the month.
Good Morning!
Am I wrong if I say that this is not enough stopping volume? I’m a bit confused about the candle I marked with “?”.

Short EUR/USD


am on this trade too but my proble is always when to take profit or lock B.E CAN YOU PLS HELP WITH AN ADVISE DODGE?
pete pls cxan you just help with a picture example of a reversal signal with this vsa…am kind of confused now …am still trying to spot one from older post…help pls…
Rumour melt-up after some news hit the market - this news was later refuted and down it went again. It’s a by-product of a market that is extremely twitchy at the moment and reacting heavily to all sorts of information in a knee-jerk manner. Bummer if you get caught and stopped out in a move like that as there’s no way to see it coming but that’s what stops are for I suppose.
Hello,
I’ll be happy to learn more about this system. Where do you suggest me to start ready from, because the whole thread is very big.
Thank you!
Hey Danny K,
Your question about stopping volume needs some clarification. I hope this helps (and I hope I am correct - please, anybody shoot me down if I am wrong).
Stopping volume, I have read here previously is a volume that is significantly higher (maybe abt 60%) than the last 10 bars.
If that is the case (I think it is), if you look at your chart, it was equal volume to 5 bars ago.
Obviuously, this type of trading is “technical trading” but you cannot ignore the fundamentals. High impact news needs to be steered away from. It has already been correctly said that the market gets very spooked quickly, so we do need to be away from the news a bit.
Hope that helps in some way 
Hello, this is my first post but I suggest you read from the start. I just finnished it now and have also read MTM Tom Williams 2x and pete his videos on youtube. You will find everhything you need to know in there.
I’ve been introduced by VSA thanks to a recorded webinar of Tom Williams and his partners but in my opinion they make it way to complicated for a newbie to understand it. Somebody I know bought there software in the past and told me better not use the software just read his book and this seminar (it was included in with his software). I did but left still confused because most of the time they tell you how it works but then make you feel like you need their software to really get the most out of it, and I almost did since I believed it would make my learning go faster.
Am I glad now today I didn’t do that because I realized thanks to petfader’s thread that it would really make me a less better trader as I would rely on a bunch of indicators and not see the nuances that move the market.
All this just to say how powerfull this thread really is, I read it studied it and enjoyed every minute of it because I startded to really feel that everything became so much clearer as I progressed the post.
I want also thank Pete and all the others who took the time to post their charts etc to help fellow noobies. My learning curve is very bullish thanks to all of you.
This is my entry. Lets see where it goes. As I see others are on this too. I am open for your thoughts.

Thanks for your respons
In my opinion that was not enough stopping volume but as it slowed down at the 61.8 fib I got a bit unsure so I was simply looking for others thoughts on it.
Hello pandras!
What made you enter? Explain a little bit more, otherwise it’s hard to give any thoughts 
Hi Pandras82,
Can you explain your reasons behind the entry. I am assuming you went short - and done quite well out of it, but from what I have learned to date (I am no expert at all), the 1hr is in an uptrend and we should be trading with the trend??
I have had a look and seems like you are looking at the 15min chart??
Looking at the chart (live chart), it liiks to almost have a no supply candle and could be waiting for a confirmation Bullish candle for a long entry??
Looking forward to hearing your thoughts behind it
I closed this with +1 pip, it looks accumulation phase. Any suggestion for a newbie?
I think it looked originally like you missed the bus with the short though maybe it’s starting to take now.
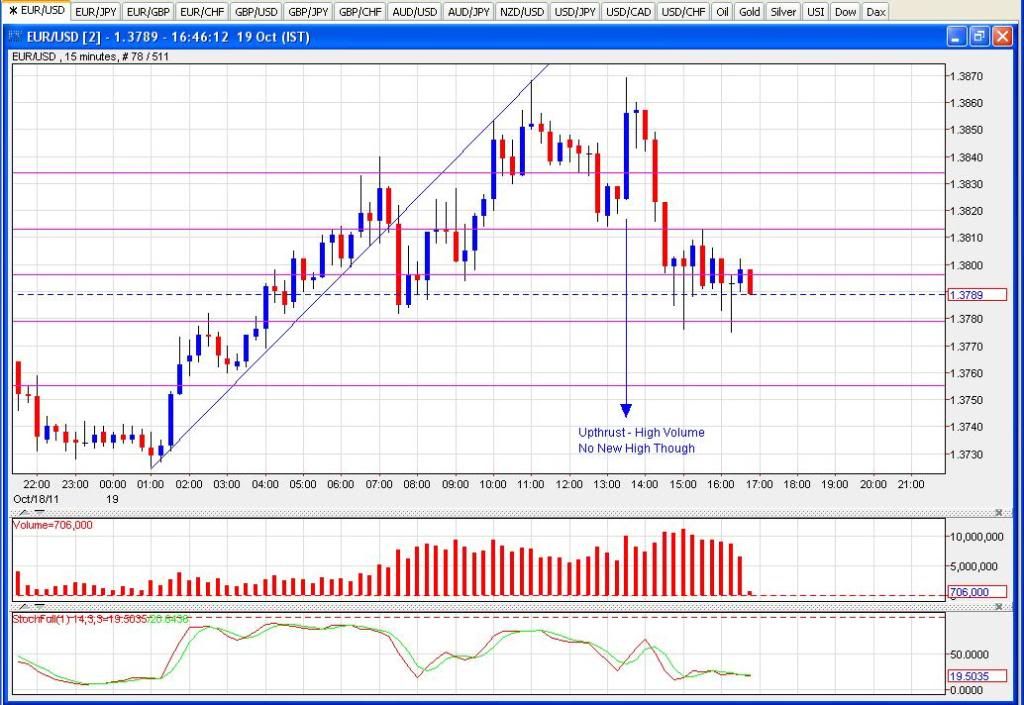
I went short two candles after the 2nd candle after the upthrust had closed at . The upthrust with the highest volume of the day (at that time) didn’t make a new high which suggests selling pressure. The next candle had pretty high volume but couldn’t get up to the high - it also looked like buying pressure was stalling as although they managed to stop it dropping it was only just about. The next bar seemed to indicate selling building so I entered after that closed. Closed out at 1.38 after price bounced up and seemed to be basing at the 61.8 area. Looking now like it might dip down some more again but so be it.
The one hour chart has been showing an uptrend until the last 3 of 4 hours, then it has gone back down. If you draw a fib on the one hour chart from its low at 1.37239 to its last high at 1.38686, you will find the current price (1.37818) right on the 61.8 fib line. Look left of the 1hr for some copnfluence with that fib level and I see previous resistance at that level 18th Oct @ around 0500, 13th October @ around 2100, and support 13th October @ around 0200. All my times are GMT+2.
My guess, or hope is that it will reverse at this fib level/support line and resume it’s prevailing uptrend. With any luck, we will see a low volume no demand down bar followed by a bearish confirmation which will give a long signal for me.
Then again, if it doesn’t, let it chop around as much as it likes. You don’t need to be in a trade, so just be patient and wait until it screams at you to make the trade. You will trade less, but you will also win much more than you lose
Just remember that I too am a newbie and learning quickly. It will take time, but when the switch turns on with VSA, a whole new world opens up
hourly chart about my entry. I re entered after my escape before 
I also saw a bearish divergence on 30 min and hourly TF. Also my channel broke down and Fibonacci lvl 50 held.
high volume was seen on that big up candle but there was down continuation after it so where that volume came from? Smart money absorbed the demand and I had look at the smaller TF it said the same to me.


Be careful making trade decisions based on volume on a 4hr chart. I don’t think it’s very reliable.
Thank you for your reply. I usually try to look at smaller TF. But on 4 hourly I also see a froming head&shoulders pattern what is in balance with the previous trend change.