Exit half at +80, stop set to BE.

Exit half at +80, stop set to BE.
Hi Dodge,
I like your live charts. I also grabbed some pips on the down move. VSA works very well. I need more study, practice and confidence. The market favored me today.
Sorry fabulono, it’s a judgement call. Set them at levels of Support/Resistance either when you see signs of a reversal.
Thank you very much!
I have to widen my volume window 
Look at your 1h chart and you’ll see stopping volume around previous support (that started the previous upmove) and you should be able to predict some kind of upmove there. Would have posted chart but im on my iphone atm.
According to a guidelines document released this morning the EFSF will be able to buy bonds on the secondary market provided the Eurozone country has sustainable debt. This had been one of the sticking points though plenty of others still remain e.g. if / how much the fund will be leveraged. But the release was enough to send E/U screaming upward this morning. How long it lasts is another thing. EZ always over-promises and under-delivers but I’m not going to short just yet - the Philly Fed reading is coming up later this afternoon and if it reads good there’ll probably be more upside as that’s a good indicator of the ISM reading.
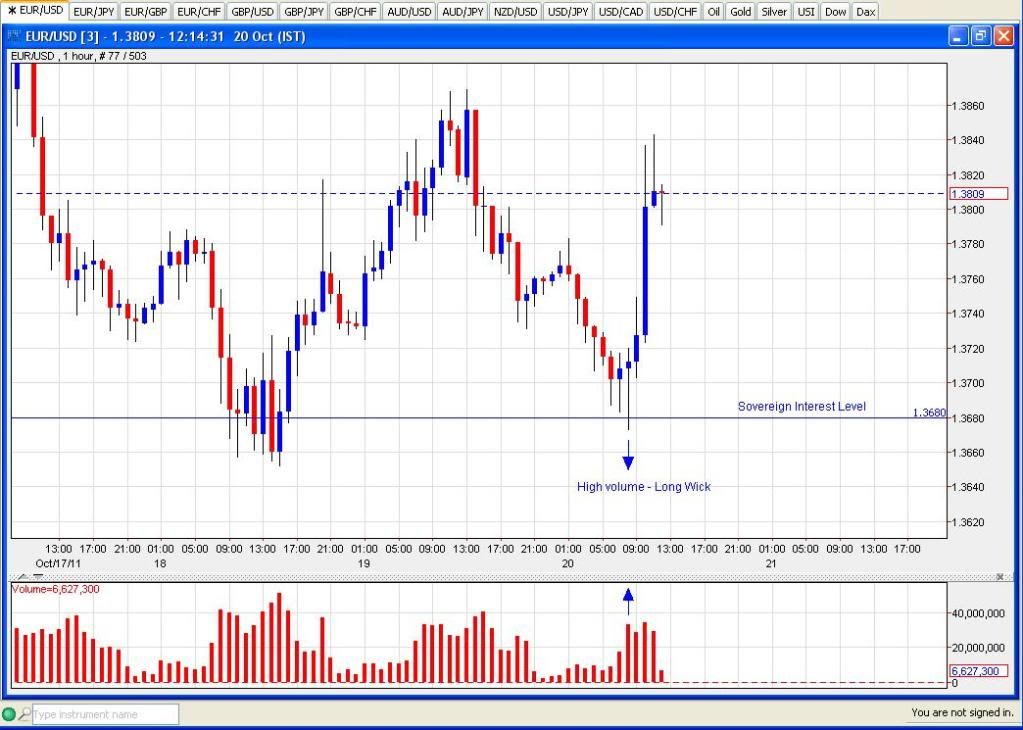
You could see it on the charts as others have provided. There was clearly quite a lot of volume once price took that early dip as buyers stepped in. That was a sign that the 1.3680 level was one attracting a lot of interest (was actually sovereign and ME buying interest).
I do not see stopping volume on hourly chart. 5 min and 15 min I see. I saw stopping volume on 5 min but didnt think it was going to be enough to push the price up that much.
Please show me the stopping volume on hourly. Thank you very much in advance.
Could this be a buying climax?
pls is dis the rules u keep to all the time befor taking any vsa trade? and how do you identify a no supply/damand?
It probably wouldn’t have pushed price up that much normally - it seemed to be labouring a bit around the 1.3730 area and the Euro stock markets weren’t doing great. But then the EFSF news caused a run away spike that would’ve tripped stops on the way up as new highs were made.
1 Hour Chart:
You can see there’s a long wick hourly candle with high volume - this shows that at the London open they tried to push it down but it was bought up at the lows which overwhelmed the sellers and pushed price higher. It stalled out by 1.3740-50 as there was offers there but once the news broke they got smashed.
Was smart money not able to absorb this huge demand?
Thanks FX Davista. I will start reading the thread from the start. I’m really glad I’ve found such a great community forum!
Read The Book. :54:
Live webinar now: gotomeeting ID 295-695-794
Active in the forex market you’ve got:
Sovereigns
Sovereign wealth funds
BIS
Central Banks
Corporate treasury departments
Custody Banks
Semi-official government agencies
Hedge funds
Model funds
Real money
Prime brokers
Clearers
Retail traders
In my opinion it’s tough to divide up that group into “smart money” and “dumb money” (except maybe for retail). The sheer number and variety of participants makes it a very different prospect to stock trading where the smart / dumb money idea may be more applicable. There’s a lot of smart people working in the those various organisations above and they may have different aims and they’re probably looking at different time-frames to achieve these aims.
Whichever group(s) has the more clout on a particular day will win the day. This morning the bulls had the clout though things are twitchy out there and it can easily swing around.
pls were is the book pls…attach it for me pls
Got out just in time, for 130 pips on the second half.

what was your stopploss and were you buying or selling…post a trade only when you took it so we see it in your platform.
If you mean [U]heavy[/U] money: Heavy money doesn’t usually care about 10 pips. They trade on daily/weekly tfs. What happens between the s/r zones of those h1 charts is not of any interest to them. They just look for the bigger tfs s/r zones.
You can see this if you have for instance a chart with a daily tl below and a weekly tl above close together. That’s ususally the situation where heavy spikes occur. Because the heavy money is responsible for activity there. No matter if they just hedge or trade for profit.