I laughed while reading this because I was about to write the exact same post! I decided not to, because I did not want to possibly offend you by suggesting English was not your first language :o
In the Stock Market your assertion would be correct (shorting works differently with Stocks), but in Forex there is a concept of “gathering” a short position, since there are two sides to the market, in this case the Euro and the Dollar.
I won’t derail the thread any longer, if everyone here is using the word “distribution” (shed or release) as the equivalent of someone starting with no position in the market, then entering short, (technically not releasing anything, since they started with nothing) I’ll oblige
Thanks, lets let this one be done. . . I to wanted to make a post in jest, but this is a pretty good little thread, lets not pollute it with arguing over this point.
If there is honest confusion, by all means lets clear it up. otherwise if you get it - lets leave it be.
And this is NOT directed at anyone in particular, I just wanted to agree with DodgeV83 - lets let this one go.
First of all nice thread. Been really helpful in explaining why I’ve constantly found myself on the wrong side of the market. And why those news moves always baffles me beyond comprehension. Not claiming that I’ve fully grasped all the concepts yet but I hope I will in time. Anyways.
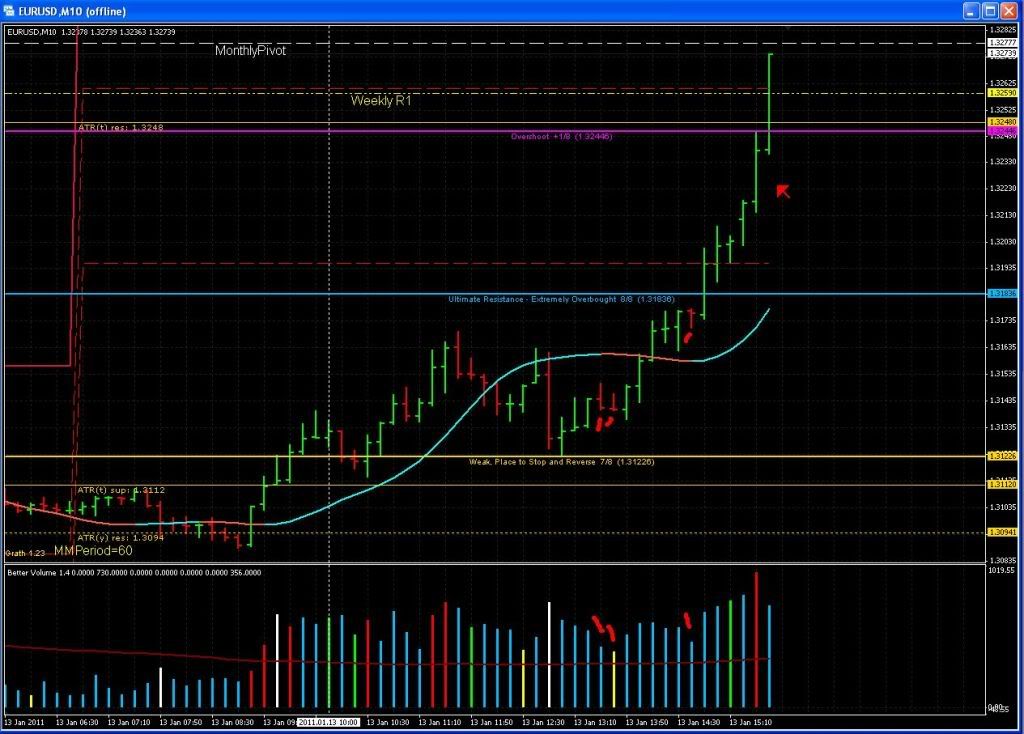
I’m attaching a 15m chart from today with a few notes and was hoping for someone to act a bit wise after the events, so to speak. I would be especially grateful for some points on where supply\demand dries up, if there are any signs of that on this chart. Feel free to up your own chart and comment on that if that is more convenient. Also, don’t be shy to point out any misconceptions from my end, I won’t be offended.
I think it depends on the reaction in cases where there is no wick. If I see a high volume down bar that closes near the bottom, I will look the the next bar for more info. [I]If it can’t break the low of the first bar, then I would consider it strength[/I]…smart money absorbing selling to halt further down move. That would put them LONG off that area.
Thanks for the contributions guys. Nice to see people using their brains to trade.
Your chart is 100% correct. I personally was only looking to short yesterday from the top of the range due to the high volume rejection of break out, on the left of your chart. When price came back up there for NY I shorted. I also labeled this range as re-distribution, making shorts the safer way to go. Your trade is valid, it’s just a question of style and risk.
Very nice and helpful thread. It took over 1 week to read. I didn’t want to read all at once, 'cause it’s hard to remember that way. I was trading in same time. At first, I didn’t see anything on live chart. But when I looked back, it was so obv. When I watched your charts, it was also so obv. Everything makes alot sense. In live situation, it was just too hard.
But now, after little over 1 week, I start to see what you see in live chart. Some basic stuff of course, nothing fancy yet. But, it’s improvement.
I have Master the Markets in my computer… I should read that, but I haven’t started yet. I will do it now. This thread was just more interesting I think.
Buyers still strong. Looking for price to come down on low volume to add another position, possibly off the .3000 mark. Missed the first oppurtunity there, 5M had a rounded bottom.
Yeah, I got in on a small short scalp on .3040 (profit target 15 pips or so). Then I’m hoping to get on a long pos if I see a good entry.
-Bagged 12pips as it bounced off of my 14 period moving avg on the 5m. A scalp is a scalp. Let’s see where it goes from here. Like you I am expecting a good entry around .3000 if everything lines up.
Not the best of entries but took it. Price holding up above .3045 after some sell orders got hit. Closed half and rest at BE. Will probably getting shaken out before price gets ready to go up again.
First grey box, high volume down bar without a significant wick that couldn’t break the daily pivot line. Wait for the next candle, it [B]doesn’t[/B] break the low from the first candle. Go long. TP taken.
Second grey box, high volume up candle without a significant wick that couldn’t break the daily pivot line. Wait for the next candle, it [B]does[/B] break the high of the previous candle. Go long. TP taken.
If volume increases a bit in the next 5 minutes, the current candle might give a good shorting opportunity. Will wait for next candle.
Which broker are you using for MT4? That down wick did not show up on my Oanda account, but it did show up on my IBFX MT4 account. Good thing too, it would’ve blown through my stop :eek:
High volume candle without significant wick, unable to close past the “mid PP R1”, or touch the top fib line. Next candle [B]does[/B] break through the top of the candle.