Straight down maybe, or muck about between 1.37 and 1.32 for a couple or 3 months.
I traded #1.
Got out at #2.
#3 is just an analysis, further supporting my reasoning behind never setting SL to BE. If I wanted a larger TP and set SL to BE, I would have been stopped out.
Didn’t trade #5 since I was busy at work 

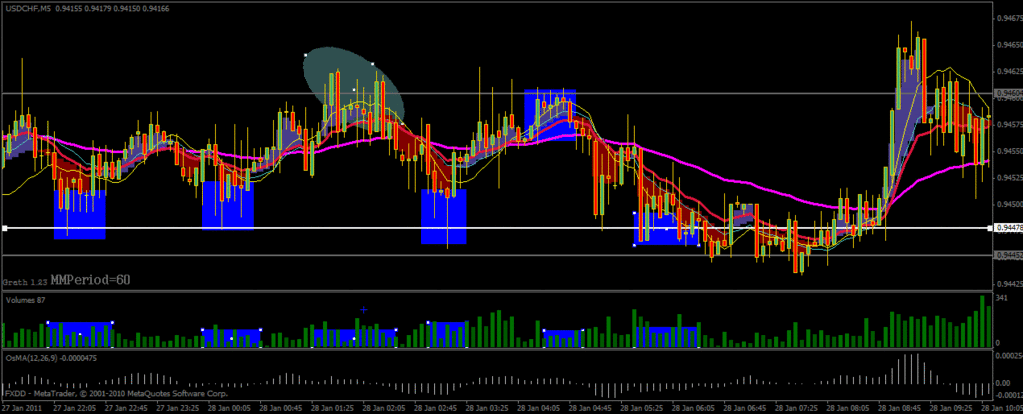
My confusion with this system is sometimes I see a trade made because of multiple bars of volume being high or low. Then sometimes you see a trade being made because one particular bar had high volume. I really like pictures that show exactly what you did and why you did it Thanks for those guys I’m still trying to learn this.
Show us some of your failed trades and we’ll let you know if the analysis was valid.
I had no idea what to do… how could I have forseen it going up?
Also, the volume spike with the oval, is on a bar that goes way up and way down. How am I suppost to know what that means.
Which point specifically are you referring to? Show me exactly where you took the trade, along with the reasoning behind it.
I personally don’t like trading volume on the 5 minute charts, but some here have had success with it. Maybe they will be able to help you more.
and this pin bar, it has just as high volume with the sellers, as earlier the volume was with the buyers. Theres two pin bars there back to back so id what to do I guess
Like, nothing specific with the one with the blue squares. I mean, the highs and lows are the same volume, so how do I predict what will happen?
What time frame do you use? how do you pick your trades?
Looking at that chart I can’t tell how much volume that pinbar has, it’s too small I can’t match it up visually.
I don’t think anyone here trades the 5 minute exclusively. They look at volume and price action on a larger timeframe, then maybe go down to the 5 minute to choose an entry point. Looking at my charts it’s easy to see which timeframe I trade on
Honestly, maybe someone else will help if you post a chart and ask for a blanket analysis, but in my opinion you won’t learn that way.
Post a chart of one of your trades, show your analysis highlighting specifically what candles you are referring to, and I will give my opinion.
Here’s a test for you. Only kendallb183 respond please 
Based on your knowledge of volume and price action, where do you see price going next in the following unrelated photos of a 1HR chart? Keep it simple, give a short analysis and say “long” or “short”.


long, short, short?
Why? Give some analysis. Would anyone else like to chip in as well?
SHORT - First chart – bullish OB – at what looks to be at least a minor S+R level, with volume I think short on open of next candle or short on break of low of this candle
LONG - Second chart – according to the text, this is a sizeable down bar, but actually is a sign of strength because of the longerish wick on the bottom, go long on the open of next candle - - also this sign of strength should be paid attention to for the next dozen or so candles - - if you find another reason to go long, remember the strength you see here.
CAREFULL LONG Third – a high volume pinbar – time to go long – but Ithink there is weakness abundant here because of the ‘mushroom’ top – again according to the text – a big move up is not sustained it’s fizzling out. So at least be careful with a long here, I think I’ll wait for a sign to short.
00ps I number the charts backwards. I’ve renumbered above
i’d also say
1- long
2-long
3-short
for pretty much the reasons PerchTird pointed out
#1. I would go long here. High volume pinbar reacting off the pivot point. Probably would have gotten out for +50 pips.

#2. I would go long here as well, high volume red candle with wick reacting to pivot point. Would have gotten out at +60 pips.

#3. I included this candle on purpose to show how the market likes to trick us into bad trades. I don’t see any reason to go long on this candle, but that’s where the market went.
I personally would not take a trade here. The bottom wick and close aren’t really breaking out of the range. This is the type of trade I would not feel bad about not taking, even if it would have ended up being profitable. There is too much uncertainty in this trade for me.

High volume pin bar on the first one, sign of reversal.
I’m really now quite sure how to analize 2. The sellers had high volume, but when it broke down, the shadow showed buyers soaking up the price with the highest volume on that bar.
- Double top on the green dotted line/red dotted line. High volume at the highs show sellers in play, and a green bar with a larger red bar shows a reversal and sellers taking back over (with the volume)
Hi guys. I’m still on vacation but will trade here and there. Trade 3 is a Long signal, although risky. Think about it…a High Volume down bar at resistance that makes NO NEW LOW. That’s herd selling being absorbed (bought) by smart money. It’s not a trade I normally take, as I stick to the buy low sell high rule…never breakouts…but just to understand.
Strength first appears in DOWN bars, and the reaction confirms. That’s how you stay ahead of the pack.
Interesting, I hadn’t thought about it from that point of view. Thanks for the input!
Hi pete, i don’t get it, the latest down bar is clearly made a new low compared to the previous bar. Do I comprehend it right, [B]lower low or new low[/B]? 