My issue is that even tho I know the markets are fractal, I have a difficult time acknowledging that “pattern” on such a small timeframe when VSA for stocks seems to suggest this appears over a much longer time…like weeks! However, this is forex not stocks so this may be another one of those “adaptations” to be aware of.
You can never let your guard down, but here’s a thought - forex turnover is so much bigger than any particular stock so it might follow that it happens quicker, but at the same time as being one heck of a lot more potentially lucrative, it’s also that much trickier, just a thought.
This is a great thread, I’ve read the whole thing and have taken notes on it. I tried trading last week from 8am-1pm everyday and made a 12% ROI (in demo of course) with a hit rate of 20/23. I’m going to try this again this week only aiming for much more realistic returns using tight money management and taking fewer trades. I will post any trade I take on here. Thanks to all who contributed to this thread, especially petefader.
Tom Williams always says that VSA works on any timeframe. In case of forex I find it best to use M5 and M15 charts because higher charts show the every day rise and fall of the volume and it is harder to see the extremes.
I use MT4 with IBFX and my daily charts shows always 5 normal volume bars and then one bar with no height because it is a saturday bar. Does anybody know how to turn off the weekend data in MT4? It is distracting.
Contributed! an understatement? The guy has stuck his neck out, put his reputation on the line, taken some flak, I could go on.
The proof is in the pudding and here we are right in the middle of it.
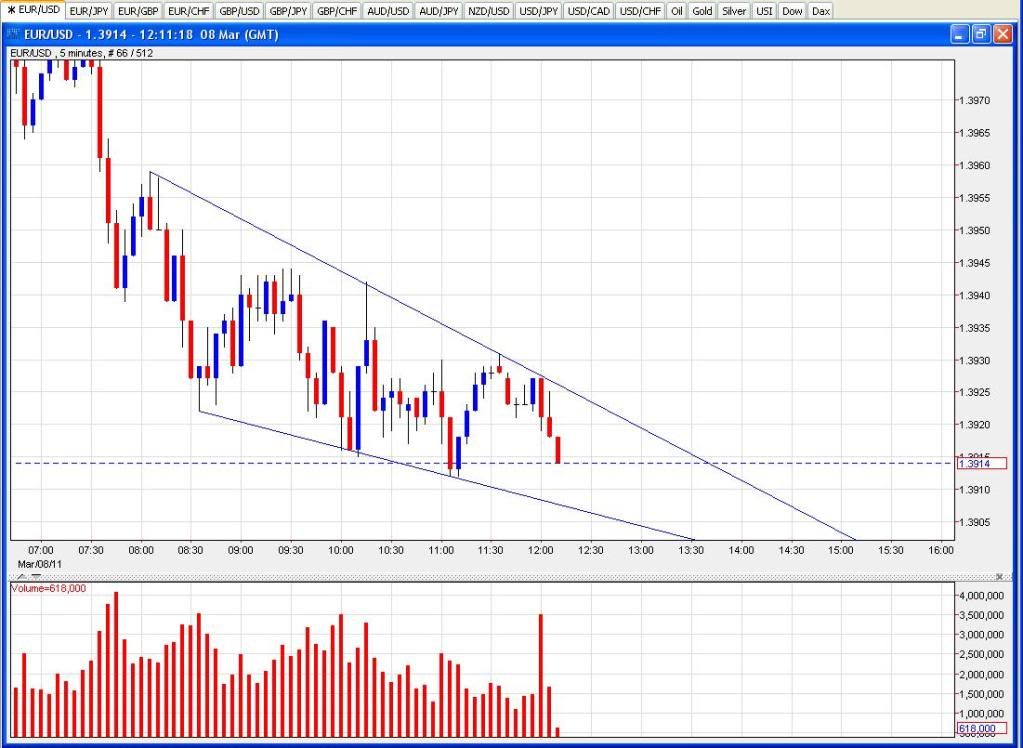
Oh look is that a head and shoulders phase I see forming before my eyes on the EURO, look out for an ‘inverse markup’ on the NY session, i.e. a bullish NY session? Discuss please…
Was looking at that but thinking now it seems to be breaking down. I’m looking at 1.3850-60 for a long entry if it gets down there. I lost a bit yesterday afternoon jumping the gun on getting long with G/U so am going to try and wait for a better value trade.
That’s where the fibs come in! ignore the little red line that just shows the current low, but the yellow and the blue fibs and the head and shoulders that is forming, and the volume spikes made me go long at 1.3915!
Did that volume spike have you jump out for a small gain or B/E or you hanging in there? Looks like a falling wedge to me but I’m not going to enter off of it yet. Volume looks to be saying more of a drop ahead to me but I’m not confident with entering any trade at the moment so I’m staying out until I see something I like more.
Ok, so only a few pips out of that one for me, NY might even be bearish, it’s unclear for me at he moment at least, so stay out until we get more clarity, it could well be the case that the market will just dip below 1.3900, wait and see.
Mind to share which broker are you using for the chart?
I’m using IBFX and I do see the increase in volume for that particular candle but not that obvious as yours.
I’m in work so I’m using the Netdania package. It’s all Java based which is what I need as I can’t install anything here in work on my PC. I’d say stick with IBFX. I like Netdania for drawing S&R lines though - you can get nice wide views on long-term charts to see the common vibrating points.
Thanks PipBandit for your reply. I have been reading this thread for a while now and trying to spot the high volume reversal candle. Will keep checking out the graphs you post. Thanks to Pete and all those who contributed too =)
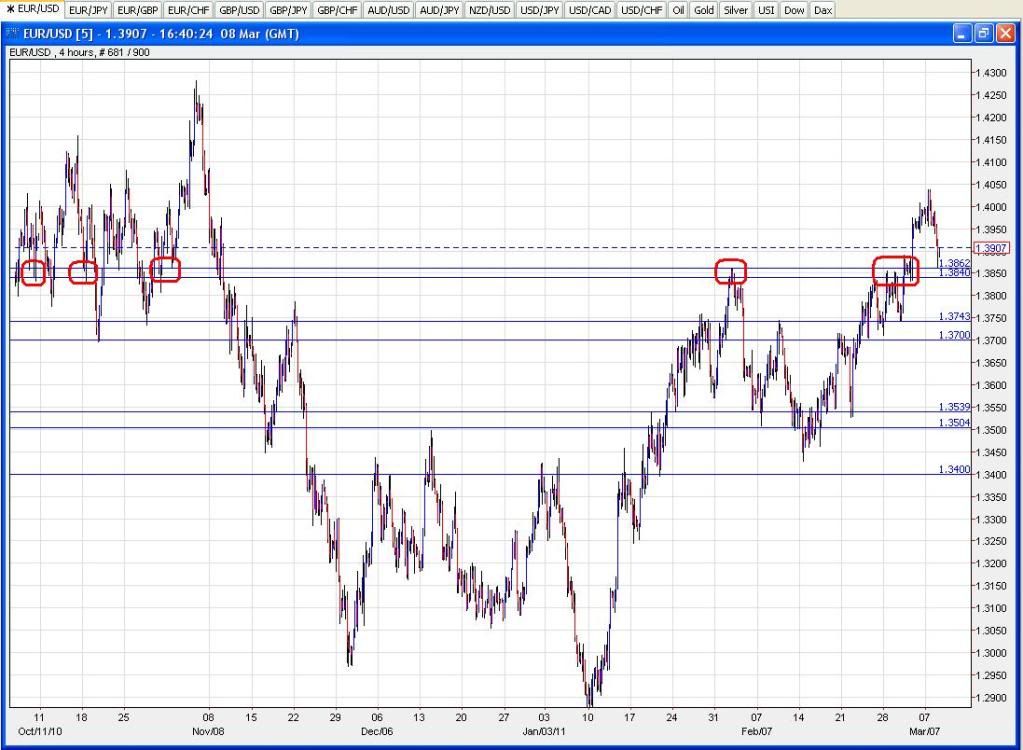
We’re mainly seeing a reaction, in my opinion, to where the first range of bids were probably clustered given that the 1.3840-60 region was a point which exhibited some fairly sharp moves in the past couple of years.
I missed it due to work. If the decline does gather a bit of pace the 1.3700-40 region should be another area where there’s a lot of bids clustered.
Buying E/U on pullbacks has been a good value trade for a while now though and this first level of bids has held up quite well initially but the rumblings around the Euro have been growing a bit louder lately so we’ll see I suppose. I’d like to try and short the Euro down to 1.37ish but the prospect of 3 interest rate hikes this year (if Weber is to be believed) might make it tricky. Though 3 hikes would probably put a serious hurting on the periphery and might cause all sorts of Euro conniptions. Time to sit on my hands and wait to see how things play out from here. Sure hope they don’t hike them personally - I’m on ECB+1 tracker mortgage and this recession has been a godsend for me!
Nice try…lol. Usually distribution is at the top, then markdown and redistribution, and finally accumulation at the bottom.
I suppose it could depend on how you look at it. As a pair, then you’d look at it from the base pair perspective and read it like usual. If by quote pair…in this case USD… then you’d be reading it in the way your diagram illustrates…another forex adaptation?
I’ve been thinking about what you said about being adapted to Forex, and my conclusion was that it would never had been developed for Forex since Forex didn’t exist when Wyckoff developed the idea, so it was developed using stocks, but of course you still have to ask the question, which is why I’ll do this for a while to see how valid the interpretation is.
You could say the same for Elliot Waves I suppose, to which Wyckoff’s theory bears an uncanny resemblance, and again there is no de facto right or wrong.
A while ago I started a thread about the ‘dogleg’, it was just a conclusion I came to from observation, but to me my ‘dogleg’ = Reaccumulation = Elliot Wave 2 to 3. But it all vindicates what I say - Trade with the trend off double tops/bottoms, look out for the ‘dogleg’ and you have the basics of one powerful strategy, even if it’s just trading using a moving average.