I’m with Nero on this one, yesterday volume is highest for a while, the most recent one, higher than yesterday is from January, and it’s when the 400 pips retracement started…
I’m inclined for both long and short tho, but for me, long is safer in this situation.
Now, I also stop listening to some call orders, reported order, institutional order here and there from some gurus… It only brings me confusion. Naked chart n volume is all I need now. All thanks to Pete 
Am I crazy, or was this a spot on setup at around 3am this morning? As of now, it looks like it’s bounced off the 50 fib but I don’t think there’s been stopping volume yet.
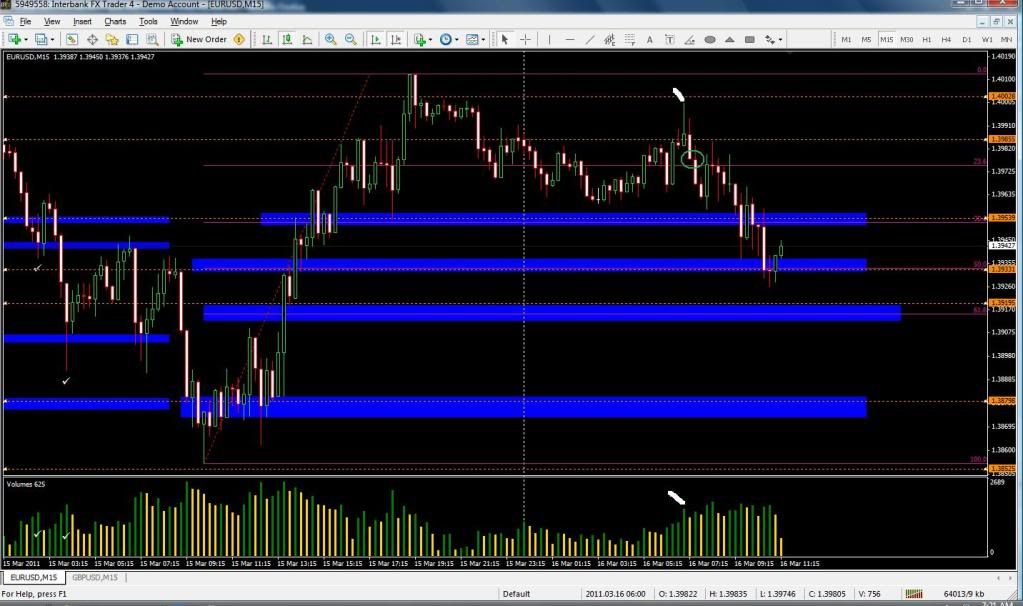
Did anyone take this? If not, is it due to the strength in the background/ longer term uptrend?
Nah, they’re not saying that. Just that there’s going to be quite a lot of resistance between 1.4025-50. To get past the 1.4050 barrier is going to take a fairly big boot is all. There’s no certainties here.
Right, a decent short signal there, but I’m only trading with the background. Yes, now .50 fibb was tested but no stopping Volume as you said. I’m being patient.
Pete, thanks for the heads-up on this one.
Turning out to be a bit of a wild day again after all. All my profit on my second GBP/CHF long of the day got absolutely demolished in no time flat. Some EU nuclear official says could be a catastrophe shortly in Japan and Dow falls 130+ points in 10 mins. Then they say they’ve no extra information actually after all so, eh, nevermind chaps? Guess somebody is quietly advising him to keep his mouth shut right now 
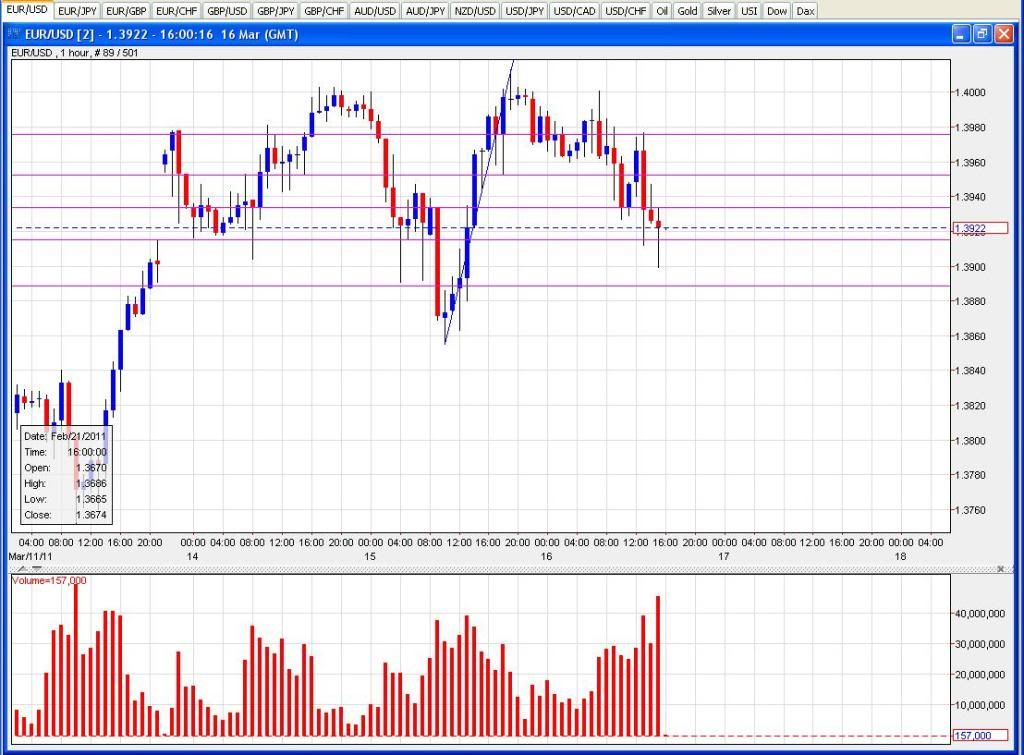
Long in E/U from 1.3918 with a small position and stop to B/E already in case there’s more EU officials who want to blab their mouths and panic everybody around the world.
Patience PipBandit, Patience, now look for volume spike and a pin bar, then go long.
Like this one

Entered at 1.3913, Stop at BE, like you say it’s a bit silly out there, but lets see if she blows in the middle of this choppiness.
Yep, was waiting to see how the 1H turned out - got the pin bar there on high volume. Left my previous entry run and added a bit more to make a normal entry position size with an average entry of 1.3916. Maybe a bit aggressive but all in all it’s been a good day so I’ll run a little risk.
Forgot to mention the 1HR chart, but yes, it’s just like Nerokoso says - it’s all in the charts - although he is getting a little ****y about it, he’ll get bitten on the bum one day, just to remind him how tricky it is to tame the markets, but he does do well fair dos.
Made 5% today just waiting on perfect setups on 1hr, 15min, and 5 min. You only need about 4 or 5 perfect setups per week to make good money at this. Thanks, Pete.
My entry was at 1.3917. Crash and burn. But no worries. Yesterday gave good pips.
It was just perfect setup today. But it went against me. But, next ideal place to buy (for me at least) is at 1.3850 area. It’s late right now, so I didn’t take new entry. Waiting tomorrow.
I was hoping down move today. But this is ridiculous tbh. 
Oh yea and hey… What is that session volume stuff? Looks sexy.
Yes, I had a short, but came out far too soon.
You like the session volume? It’s just a handy way to see where the sessions start. Copy attached, play about with the hours to your liking.
SessionVolume.mq4.zip (2.77 KB)
Yep cashed out at -10 pips here for me for a small loss. All trading is totally at the mercy of the news headlines from Japan right now it seems. Literally anything could happen.
Have a little flutter on the Yen crosses for total madness. Yen at historical lows. Wonder how many traders are praying for the BOJ white knight of intervention?
Here is a piece of article I find quite interesting about supply and demand zone, I believe it will add value to our vsa analysis as if volume confirmed in the high demand/supply level, it could potentially bring high probability entry. The article is from tradingacademy.com:
Remember, we want to buy at strong demand levels where the supply is very thin and prices are likely to rise. We want to sell at supply levels where the supply of stock overwhelms the feeble demand that may be there. Prices will halt and reverse when the current trend no longer has the pressure to sustain itself and the opposite pressure exerts itself.
We must focus on how strong the opposing pressure is at those levels. For example, we buy at demand levels because they were turning points in the past. They are levels where prices could not continue to drop and started to rise. This occurs as the supply is becoming exhausted as sellers dump shares onto the market. Eventually, prices become so cheap that willing buyers jump in and support the price. When the demand from these buyers exceeds the existing supply from sellers, prices will rise. We focus on that area as an area of demand where we will buy again in the future.
When we enter into a long trade, we want to buy at the strongest level of demand in order to have a high probability for success. Most traders think incorrectly that all turning points where prices rose will act as demand. We need to be selective in our trading. We want to find the strongest levels of demand for the best trading opportunities. Those strong levels identify themselves in the way that price leaves the level.
Think of a glass filled with water. If you grab hold of the glass and it is filled with lukewarm water, you will be able to hold the glass for as long as you’d like. However, if you grab a glass filled with scalding hot water, you are likely to let go of it very quickly. Demand levels work the same way. If prices enter that area and then move sideways or slowly leave the area, there is not strong buying pressure there and it is a weaker demand level. However, if prices barely enter demand and move quickly away, there is strong buying pressure there and you want to use those areas as buying points in the future.
Supply levels work the same way with selling pressure dominating buyers
ahh, 5 posts already
Here is pictures of the article above


Link to the article: Lessons from the Pros - 03/01/2011 Issue - Stocks Article: But There are so Many Levels!
Enjoy!
Be careful with this kind of stuff, although interesting in itself maybe, it hardly helps you to trade, you can waste a lot of time on this ‘interesting stuff’.
I’m in long today… But I didn’t buy from lows. Simply 'cause it was night. Slow time. No trades. But in my eyes, price is pushing through supply zones. Yesterday was reaccum phase. I was waiting up move yesterday, but it happens today.
I strongly believe my analyse is correct, that’s why I bought when it was trending.
Oh, just now I looked price… It jumped to that 1.4020 area. So my analyse was correct. Okay…
Target is around 1.4050 right now. I already closed something and locked BE.
Well, that was fast. Still 1/4 going for bigger profits. Ultimate goal 1.4200. But if I see stopping volume, I close. And might close before friday starts… I don’t know yet, but, work today is done anyway.
Yesterday I had another look at using Oanda volumes, and that says, there is more of a retracement before going up, will post chart later, once I know what I mean a bit more.