In this journal I will be posting my live trade results for 10 Percent a day trading.
The idea is to make ten pips a day with a lot size of 0.01 per $10 deposit. so per $1000 it will be 1 lot. Stop the days trading once ten percent has been made.
Indicators used are :-
LWMA 60 Moving Average on the 1m Chart
100 SMA on the 1M Chart
Custom Trade Direction Arrows Indicator
THV4 Trix Called a momentum indicator from the THV Cobra Trading System
Pivots SR level Indicator
Vertical Time lines indicator set to draw the hour lines
Strategy :-
1M Chart
Trade in the direction of the Arrows
Wait for price bounce of the 60 LWMA
60 LWMA is bellow 100 SMA for Sell and above for the Buy
I trade the London to early New York sessions, I don’t often trade on Fridays. Keeping an eye on news events.
WARNING: Trading such large lots sizes comes with huge risk it is advised to trade much smaller lots sizes.
2nd June 2021
Today did a Sell trade at London open. Missed a close and waited it out, I closed on 15 pips.
Why are you doing it that way rather than taking say a 1% risk each entry and calculating lot size based on that?
To make 10 percent a day would require a 100 pip move
1 Like
What is the underlying principle and calculations on which this “Indicator” is based ?
3nd June 2021
Today did a Buy trade. I closed on 24 pips. I did not close on 10 pips as the arrows indicator for the 5m and 15m also painted buy arrows so I set my close just bellow the Daily R1 line. When Higher time frame Arrows paint it shows a stronger trend change.
There was Sell signal at London open but the price was bouncing of strong support in before London open I decided to wait and see if it broke the support. Looked like it was going to but the order of the LWMA 60 and SMA 100 was incorrect when it was correct the Arrows did not appear.
With this being the 1M chart signals will come throughout the day so I prefer to wait
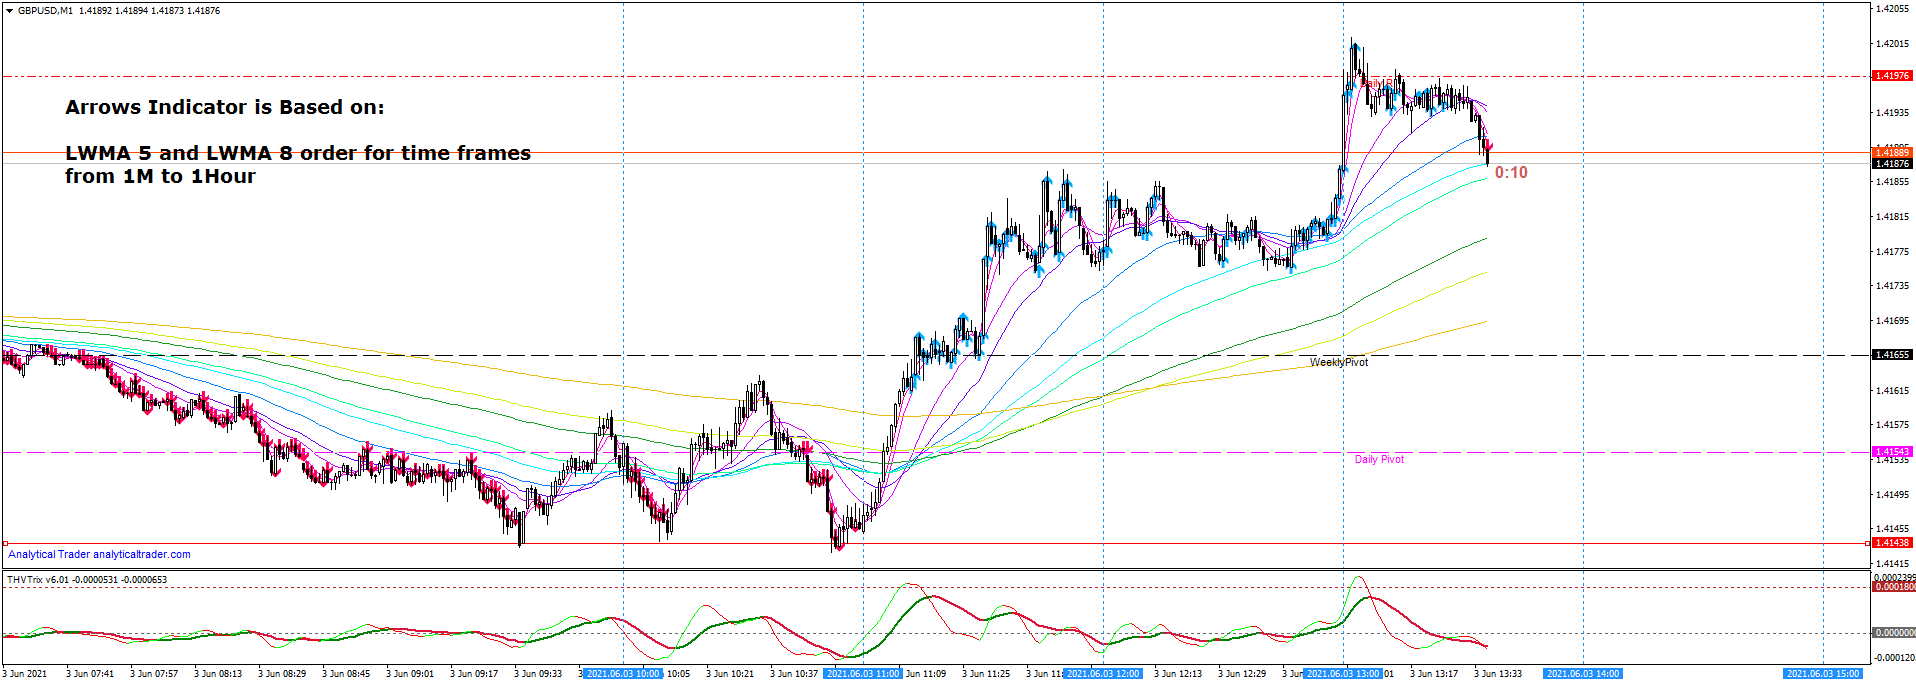
The arrows indicator is based on LWMA Moving averages for time frames from 1M to 1Hour
5 LWMA and 8 LWMA when the 5 is above the 8 on all time frames it will paint an buy arrow and the opposite for sell.
Logic:-
1m 5 is above 8
5m 5 is above 8
15m 5 is above 8
30m 5 is above 8
1h 5 is above 8
This would print a Buy Arrow
Entry is based in the direction of the arrows painting and bounce of something like today (3rd June 2021) was bounce of Weekly Pivot line also consider a bounce of the 60 LWMA a good entry . The 60 LWMA and 100 SMA should be in the correct order. I also use THV Trix as a momentum guide.
1 Like
Ok so you’re trading short - term when it coincides with longer term trend, having regard to momentum, S/R, and “News”
Nothng wrong with that.
And you trade 10% of your account per bet, which some will find difficult to accept - so I would ask - how often do you adjust your bet size ? And more importantly what proportion of your net worth does the value of your trading account represent ? - This is something which those "1% ers " fail to comprehend as important in this context.
When do you know "when to close a losing bet " ? and since London Open is particularly volatile How big is your biggest loss in % terms ?
You are correct it is a large lot size in relation to the deposit that’s why I placed a warning in the opening post.
The size of the order is set by my trade panel 0.1 per $10 it auto adjusts based on deposit amount. I close the trade on opposite arrow it can be 20 pips but the recover is usually more then the loss. In terms of London open I find it to be the best time as it gives me a further six seven hours to trade before I go home and should there be a loss time to recover.
Take a look at today for instance in the picture