is that a demo account? it sure looks like one.
I see you love to be skeptic.You have no proof of it even being a demo, but just need to blurt it out.
It is not a demo. If you are here to hate, you are wasting your time. If you want to learn something, copy the levels I drew and backtest them.
oh my…
are you sure it isnt a demo account?
metatrader has an option to generate a detailed statement that includes an image of an equity curve.
would you mind showing that to us?
sure appreciate it.
just doing my due diligence.
I do not mind showing it. Though it is a fresh account, so there is not much to show now. I want to make one thing clear though. If you are here to be a thorn in my eye, I will just ignore you. If you are seriously curious, then I do not mind. Also I will keep my own personal info private.
I hope you are this serious as well in trading for yourself 
If anyone want trading tips, feel free to ask as well. 
i am ok if you just post it here.
My trading plan
Weekend top down analysis:
Which pairs are trending the most and which are inside a bigger consolidation. -> Choosing a few pairs to trade for the week to come.
Every trading day:
- Update Dxy
- Update the chosen pairs ( mostly related to the Dxy, like Eu )
- Trend continuation? Retracement? Reversal?
Risk management:
Risk 0,5 - 2% per trade.
Trading sessions:
- London
- New York
i am seriously curious. i would like to see the equity curve for this account that began at $2900.00
1 Like
EURGBP
Price going towards upper the consolidation that is marked with a rectangle. This is when I will start took look for sell opportunities. Possible price will go above this consolidation and ‘‘fake break’’ the range. Then I will have to see how price behaves.

I use this pair for EURUSD, GBPUSD and one of my favourites GBPCHF.
Dxy
With the dollar index I am waiting to see what price will do at this low.

On the Monthly timeframe we are inside a larger consolidation. Would be nice to see price go higher to go towards the highest level of resistance in this consolidation range.
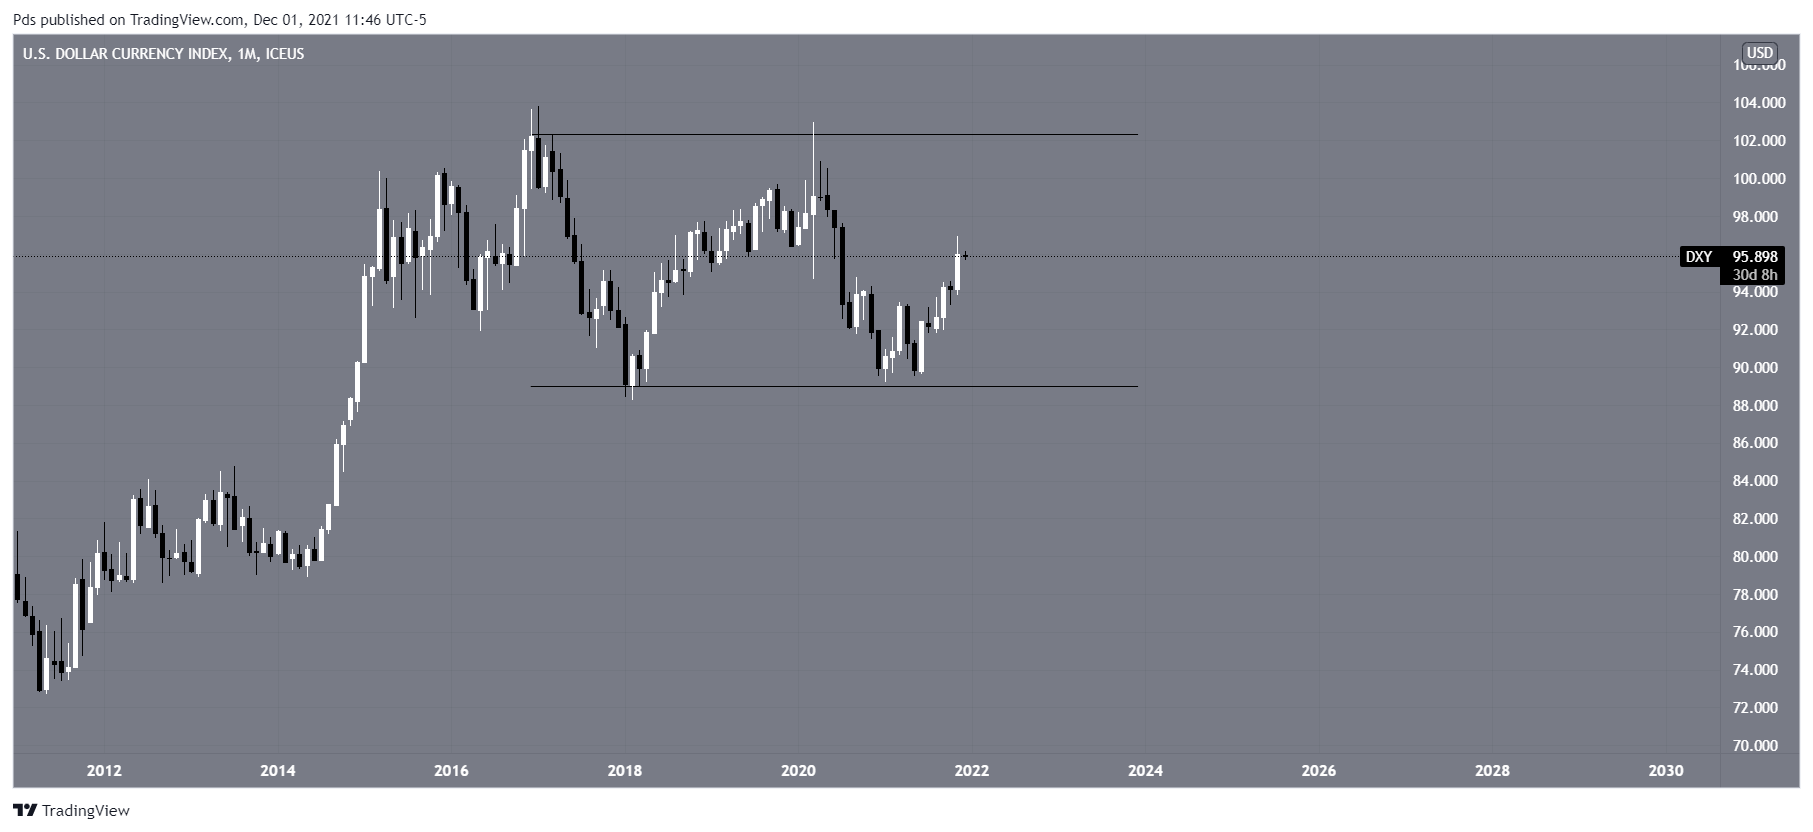
I use this Index for EURUSD, GBPUSD, USDCAD and Gold. If I want to trade USDCHF, then it is useful as well.
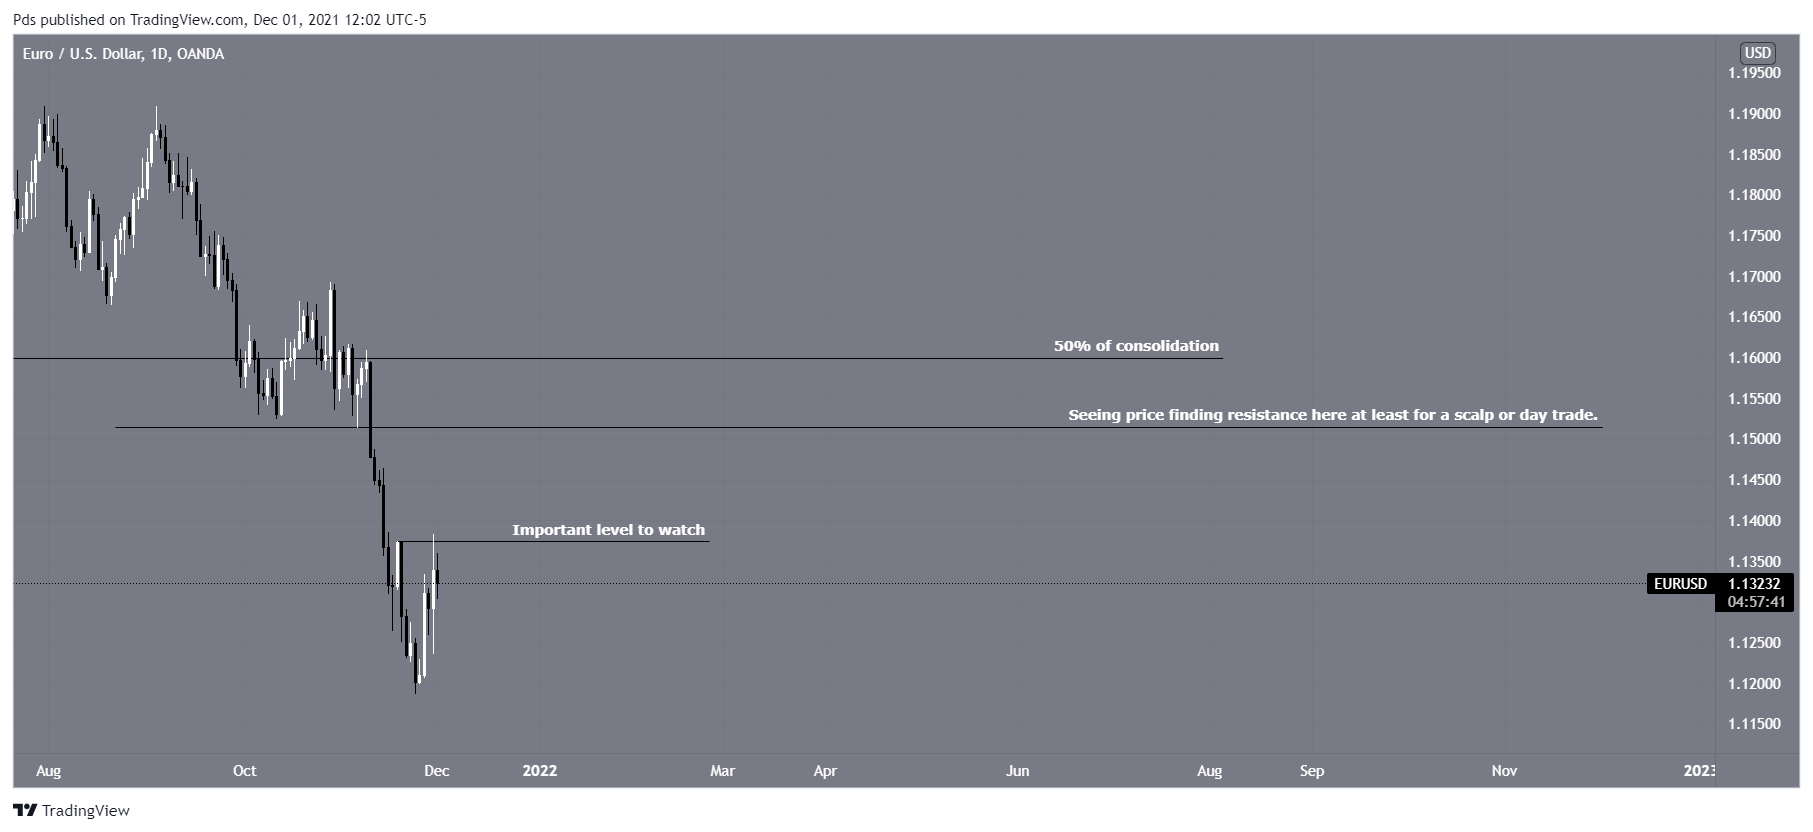
EURUSD
Monthly consolidation range. We are now in the lower portion of this range.

Daily is trending lower.
If you could hook this up to a verified MyFXBook as well that would solve the issue for most people wondering about the legitimacy of the trades. I’ll be following with interest. Keep it up!
1 Like
I agree. I do not have a Myfxbook, but I should create one indeed. Good idea! This is my student’s account though. So will have to see how to do that.
So are they taking the trades on that account or are you? Either way with your own account or theirs, being able to see your results over time as they happen will be of benefit.
1 Like

I am trading on their account.
Dollar index
W1
I would love for the dollar to retrace to the previous consolidation.

D1
Price is currently between a level of support and resistance. The trend is still bullish, meaning I will be looking for sells in EURUSD and GBPUSD till I have identified a reversal. This is the last month of the year. A reversal might occur when we go into 2022.

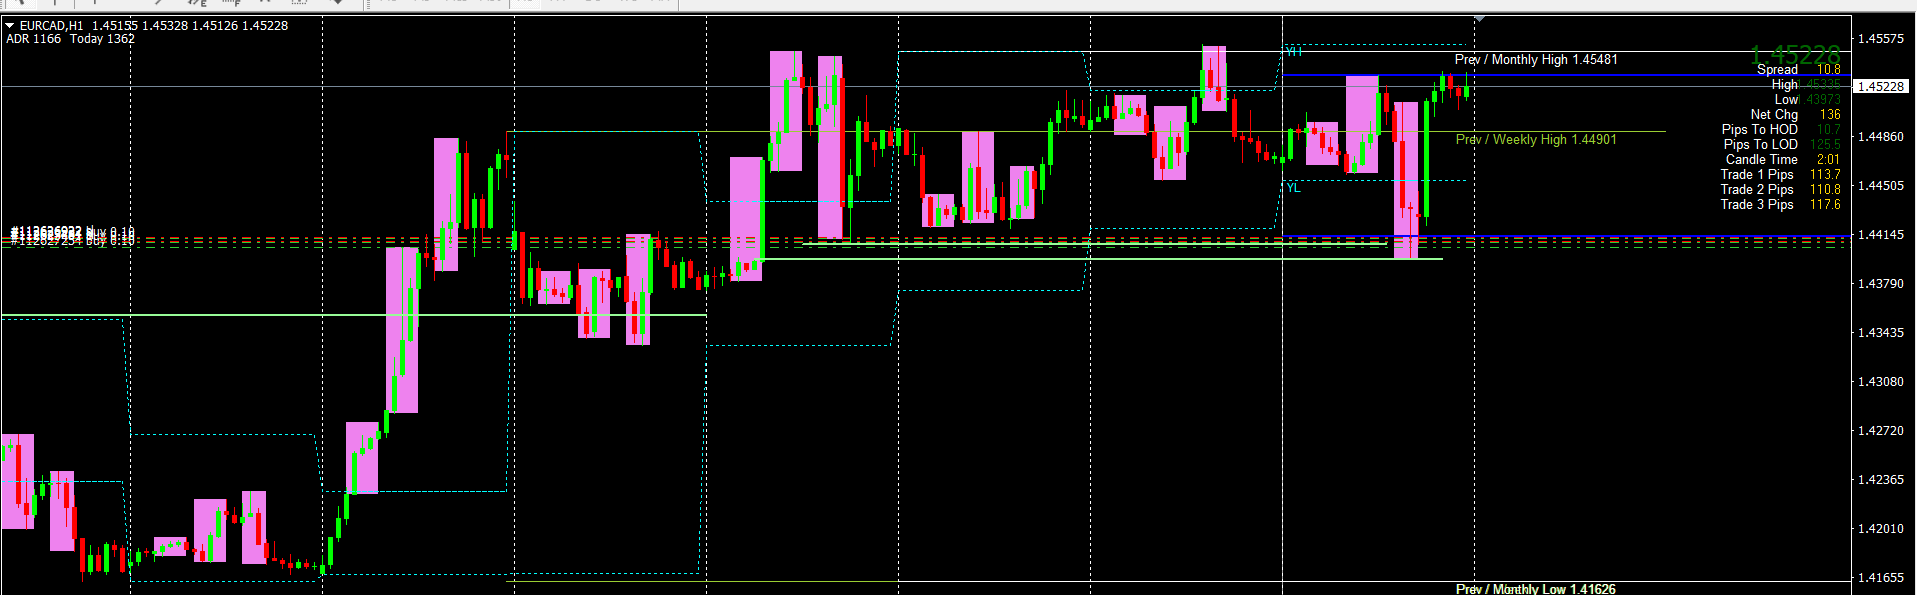
EURCAD
D1
Looking for this move to complete and will then watch if the level will hold or not.
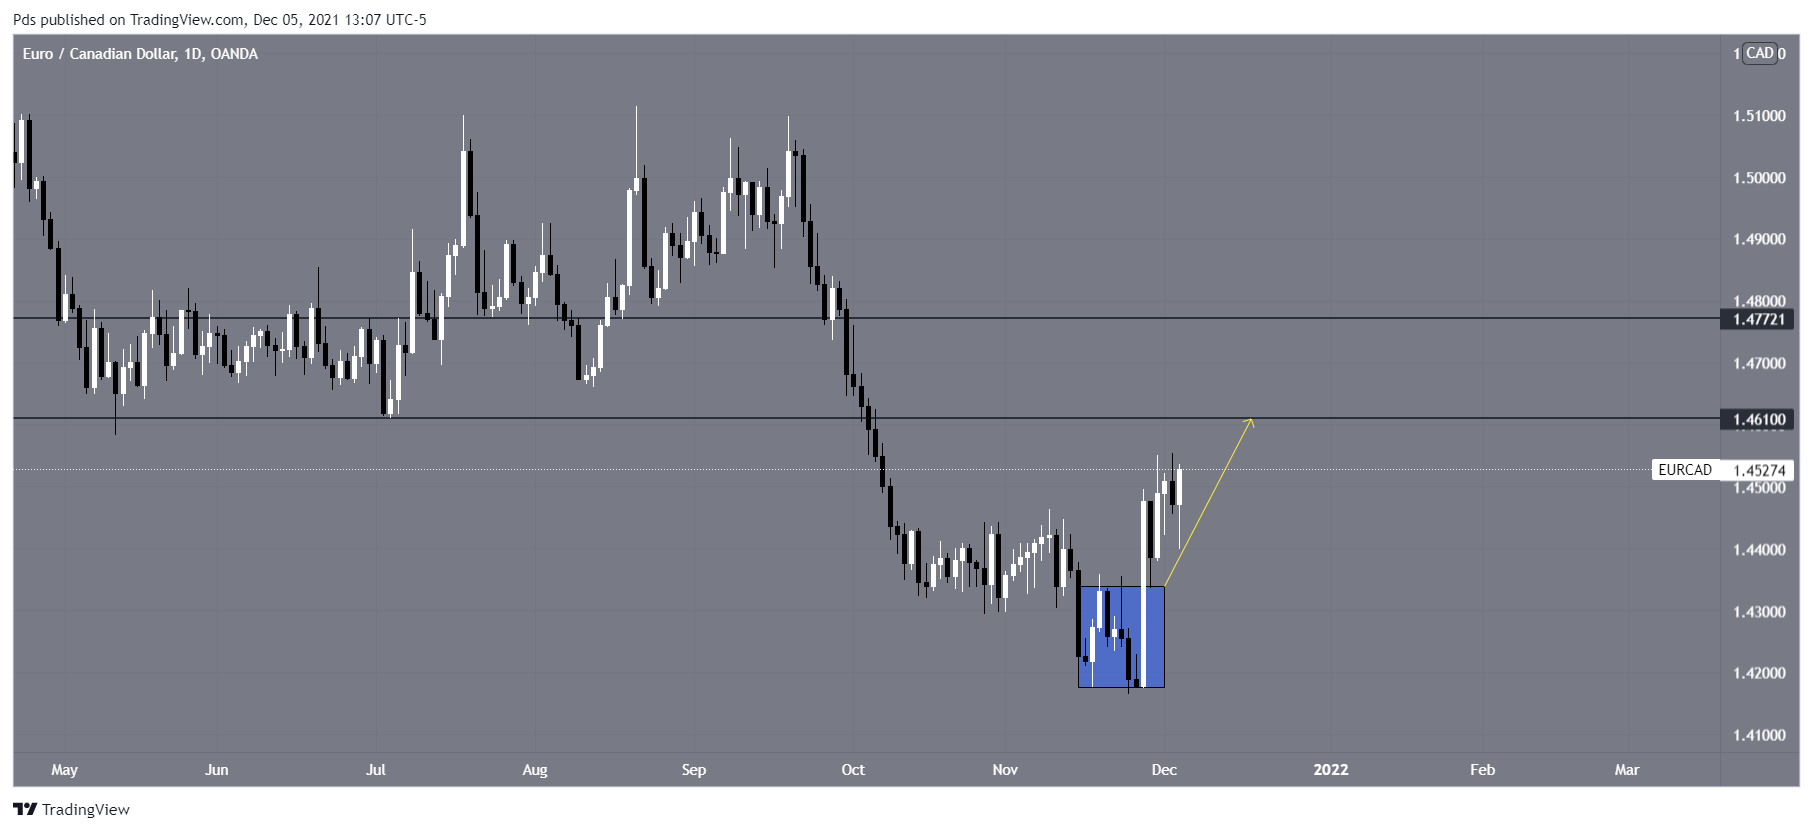
Demo entry on NFP, as I do not like to trade live on NFP days. I am looking for a continuation to enter on live account. Will see how tomorrow opens